COLAND Case Study 2020 - Nieuwpoort: Difference between revisions
| (77 intermediate revisions by 5 users not shown) | |||
| Line 9: | Line 9: | ||
{| align="right" width="400pt" style="background:Gainsboro; color:black" | {| align="right" width="400pt" style="background:Gainsboro; color:black" | ||
|- | |- | ||
| '''Area''' ||style="background:Lavender"| '' | | '''Area''' ||style="background:Lavender"| ''Nieuwpoort'' | ||
|- | |- | ||
| '''Place''' || style="background:Lavender"|'' | | '''Place''' || style="background:Lavender"|''Flemish Region'' | ||
|- | |- | ||
| '''Country''' || style="background:Lavender"|'' | | '''Country''' || style="background:Lavender"|''Belgium'' | ||
|- | |- | ||
| '''Topics''' || style="background:Lavender"|''please enter the main coast-related topics here'' | | '''Topics''' || style="background:Lavender"|''please enter the main coast-related topics here'' | ||
|- | |- | ||
| '''Author(s)''' || style="background:Lavender"|'' | | '''Author(s)''' || style="background:Lavender"|''Nafiz Rahat , Foysal Karim, Nicolas Reibel, Rahnuma Ahmad Tahiti, S.Amir H.Shahrestani | ||
'' | |||
|- | |- | ||
| colspan="3" align="center" style="background:silver"| [[File: | | colspan="3" align="center" style="background:silver"| [[File:Nieuwpoort now.JPG|400px]] | ||
|- | |- | ||
| ||style="background:Lavender"| | | ||style="background:Lavender"| | ||
| Line 39: | Line 40: | ||
== A.1 Landscape layers and their system context == | == A.1 Landscape layers and their system context == | ||
=== Geomorphology, landscape units and coastal typology === | === Geomorphology, landscape units and coastal typology === | ||
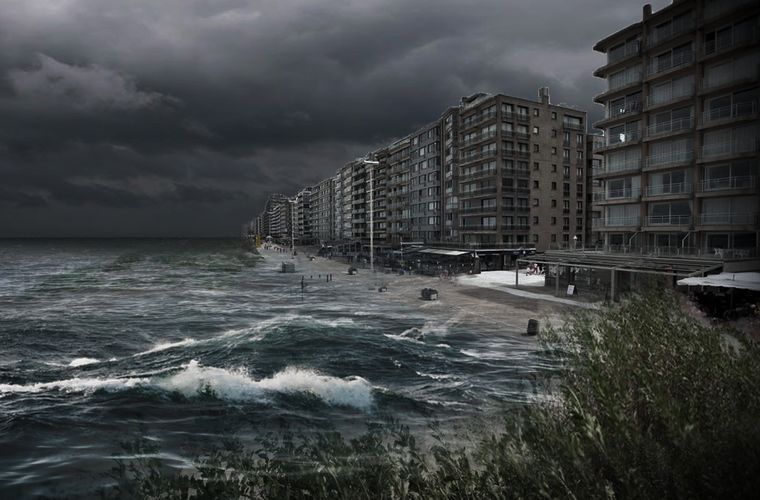
*'' | *'' The Flemish Nieuwpoort is a seaside low coast area in the West Flanders. The land formation of this low coast area results in a combination of sediments & sands. Which is generated by the process of sea waves & the current . In addition, sea shorelines of Nieuwpoort arranging with the settlements, some parts of the coast are covered with natural grasslands. Estuary of the Yser river has a very important impact on the landscape of Nieuwpoort, the river directly connected with the see & divided into five branches from the point of De Ganzepoot. The city consists of two parts: Nieuwpoort-Stadt and Nieuwpoort-Bad. Wide sandy beach, the combination of sun & sea have added the value of tourism, one of the major factor of this place.'' | ||
<gallery caption=" " widths="320px" heights="260px" perrow="3"> | <gallery caption=" " widths="320px" heights="260px" perrow="3"> | ||
| Line 141: | Line 142: | ||
<gallery caption=" " widths="840px" heights="500px" perrow="1"> | <gallery caption=" " widths="840px" heights="500px" perrow="1"> | ||
File:Sustainable Development.png|''We defined four drivers for the site that we are working on, Tourism, housing, coastal flooding, and ecological protection. These four drivers have the pressures and impacts on the city of Nieuwpoort such as traffic congestion, reduced agriculture land and green spaces, property damage, beach and estuary erosion, and rising living costs, lower quality living standards, and damaged ecology, and etc. | File:Sustainable Development.png|'' We defined four drivers for the site that we are working on, Tourism, housing, coastal flooding, and ecological protection. These four drivers have the pressures and impacts on the city of Nieuwpoort such as traffic congestion, reduced agriculture land, and green spaces, property damage, beach and estuary erosion, and rising living costs, lower quality living standards, and damaged ecology, and etc. Because of them, there are at least nine goals of the UN sustainable development goals at risk | ||
<gallery caption=" " widths="840px" heights="500px" perrow="1"> | <gallery caption=" " widths="840px" heights="500px" perrow="1"> | ||
| Line 167: | Line 165: | ||
Wintering grebes and sea-ducks call this area home, while a number of shorebird species also include this habitat in their winter foraging and roosting zones. Commercial fishing, recreation and sand and gravel extraction are a threat to this environment. | Wintering grebes and sea-ducks call this area home, while a number of shorebird species also include this habitat in their winter foraging and roosting zones. Commercial fishing, recreation and sand and gravel extraction are a threat to this environment. | ||
== A.4 References == | == A.4 References == | ||
| Line 219: | Line 213: | ||
= Phase B: Landscape Evaluation and Assessment = | = Phase B: Landscape Evaluation and Assessment = | ||
== B.1 Assessment Strategy == | == B.1 Assessment Strategy == | ||
In our landscape system analysis, we discussed four main drivers (Tourism, housing, coastal flooding, and ecological protection) which are more dominating for this particular study area. So based on our previous analysis we found some issues like traffic congestion, reduced agriculture land, and green spaces, property damage, flooding, beach and estuary erosion, and rising living costs, lower quality living standards, and damaged ecology, etc which are some of the important factors and we think these are needs to be considered for our mapping assessment. | |||
The excessive pressure of tourism creating an impact on the landscape and also it's increasing the rate of living cost. Low-cost housing areas are also getting denser for lower-income level people who are trying to get into the area. And when a place gets more populated it automatically creates mass with the public transportation system. So Accommodation facilities and transportation maps are made which show the connectivity of the whole area. Also, the economic condition of the public is shown on another map for understating about their living condition. | |||
To analyze the current situation of tourism facilities with recreational activity, green infrastructure is mapped which shows the current location of recreational zones and relation to the public life and coastal landscape. | |||
From various man-made issues and also form pollution causes climate change which is also a reason for sea-level rise. It’s a major problem of the study area which can be affected by serious flooding. Agricultural land can be washed away by any serious flooding issue so in our mapping, coastal flooding is also included which shows how it’s affecting the local landscape and ecosystem services. | |||
== B.2 Mapping == | == B.2 Mapping == | ||
| Line 227: | Line 222: | ||
*''As a minimum, at least three different themes need to be mapped, you may choose more if needed'' | *''As a minimum, at least three different themes need to be mapped, you may choose more if needed'' | ||
<gallery caption=" " widths=" | <gallery caption=" " widths="600px" heights="400px" perrow="1"> | ||
File: | File:Nieuwpoort_Morphology.png|''A time-based approach to mapping the physical changes in the shaping of the Yser River where it meets the North Sea gives a clearer picture of how the current landscape was formed. Studying these changes gives insight in to how the landscape may revert back to a sustainable ecological balance, through it’s own natural function or through the assistance of the state. In as much as the image on the left looks back, the image on the right is more of a forward projection. It visualizes the areas prone to flooding in a 4m storm surge and also points out the particular points along the shore line that are most susceptible to erosion. This information will allow for the any future projects to mitigate for the effects of flooding in particular areas, while studying where erosion may cause harm, or play a beneficial role, in the reforming of the landscape. In general, it is a better understanding of a very dynamic system that can have profound effects on communities and proposed planning and design.'' | ||
File: | File:Greeninfrastructures.png|''One of the prominent features of Nieuwpoort are the nature reserve of Ijzermonding and the dune area in the north western side. The ecosystem of ijermonding is unique on the flemish coast, here a river estuary connects with the beach, sea dunes and dune grasslands. Two Bird directive areas 'West coast' (BE2500121) and 'Het Zwin' (BE2501033) also fall inside these areas. The main Green infrastructures of Nieuwpoort are Agricultural lands, Meadows, Heaths and Grasslands. The agricultural lands cover almost the majority of the area in the southern part of the city Nieuwpoort Stad. A small amount of forest areas are present. The Yser river plays a prominent role around these green Infrastructures. Here through the lock and spillways entry point, Ganzepoot, one river, three water channels and two canals are connected with the mouth of the Yser River and the maritime port. So this is quite an important connection point. There is the potential to develop the area around the historic core of the city, close to Ganzepot, for recreation and nature green. In the Beach side and in the mouth of the Yser river and the canals, a number of water sports activities can be seen. There is the potential to develop a green belt along the bird directive sites and habitat directive sites to resist urban growth of industries or Grey infrastructures around these valuable areas.Also the city has a number of old heritage sites, which needs more exposure, so there is this loss of identity despite the presence of all these ancient monuments. The nature reserve areas in the northern part are an important part of the Cultural Heritage of Nieuwpoort. Hence to lessen the pressure on these protected areas, and for lesser anthropocentric activities in the beach side, there should be more Green recreational infrastructures such as urban open spaces in the southern part of the city. '' | ||
File: | File:Capture.JPG|''As Nieuwpoort is place for tourist attraction so it’s a important matter to identify the hot spots of attarction and also the connection with all those areas. In left side map shows some important recreational spaces which also serves as touristic attraction and the map also shows the bus stops so that we can see the connectivity through the whole area. Also bike paths are visible in the map which connect Nieuwpoort to other locations. It’s important to think about the accommodation facilities for tourists so Air bnb, hotels and camping places are also locate in the right side map which will give better understanding about how much accommodation facilities this area can provide for visitors.'' | ||
File:Densely populated area.png|''The city is divided into the 3 parts, but the densely populated area is in the northern part. It shows the interest of the housing development was the north (closet to the beach), and also we can see the green spaces among the settlements in this district are going to be smaller and in near future this green land uses will change to the settlement which will be needed. In the southern part of the city, there is potential for housing development.'' | |||
File:Population and its growth.png|''The City is facing population growth, as we can see in the last decades the city was welcoming more people, but if we look at other graphs like age groups, we realize that the population is going to be old, then the city needs to be developed in the way to bring the infrastructures which can answer the elderly people's needs. '' | |||
File:Economy condition.png|''Economy & social condition'' These problems are bundled into 4 major themes (dimensions): demography, housing, education and unemployment.This is the poverty map which is assessed on the scale of 0-4. 4 is the less good economic condition 0 is a better economic condition. (0=2) green depicts this score is for 2 neighborhood (1=3) for 3 neighborhood, (2=5) for 5 neighborhood, (3=1) for 1 neighborhood | |||
</gallery> | </gallery> | ||
== B.3 Problem definition and priority setting == | == B.3 Problem definition and priority setting == | ||
* ''Give a summary of the major findings of your mapping process, what are the problems/potentials identified?'' | * ''Give a summary of the major findings of your mapping process, what are the problems/potentials identified?'' | ||
* '' | * ''First priority is to enhance the green infrastructure by Connecting Natura 2000 habitats to make a green ring around Nieuwpoort. Secondly, relocate the residential development to medium density structures in Ramskapelle following the. Enhance the sustainable mobility bicycle path to connect the recreational open spaces. In addition, Address flooding in Jachthavenwijk & create a possible idealistic solution with the combination of traditional and environmental engineering. | ||
'' | |||
<gallery caption=" " widths="600px" heights="400px" perrow="5"> | |||
File:Problems & Potentials Nieuwpoort.png|''Overlaying the themed maps from above, we were able to locate particular zones which will be affected by a number of factors. In the south, the agricultural land is susceptible to leaching and contamination of both ground water and river waters through the transfer of salts and pesticides during storm surge flooding. However, it was the densely populated area near the shoreline that posed the most problems, and rightfully, potentials. The limited amount of recreational space and green infrastructure designated for ecology in the Northwest is compounded by the influx of tourism that overwhelms these sights. Additionally, the housing zone between the old town and the coast is at a high risk of health and economic harm due to potential flooding. There is great potential to protect housing and economy while expanding recreation and protecting it’s ecological function by shifting new residential development and introducing a green belt to he area. Both natural and engineered solutions to mitigate flooding could be paired with this approach.'' | |||
File:Problem definition & priority settings.jpg|''add caption here'' | |||
</gallery> | </gallery> | ||
== B.4 Theory reflection == | == B.4 Theory reflection == | ||
Observation, visiting the site and survey and interview stakeholders could help us get to know the situation better. | |||
It would have been beneficial if the information was available to apply our demographic data spatially. | |||
Of course, the Steinitz Framework could help us to find the clue, asking ourselves how we can describe the area of study, or what is the current situation to get to know the problems and risks, and potential as well. | |||
For the analysis part, we use old maps which could show us how the city developed, we could realize how the city changed. Reading the history of the city and the north sea opened our eyes to the culture and the people's needs. | |||
Having knowledge of Green infrastructure and its important role in climate change and in nature and human life as well. | |||
The mapping of economic status and housing overlaid with the mapping of preserved green spaces and the dynamics of the blue infrastructure has allowed us insight into the relationships between the specific challenges our data has revealed. | |||
Getting the knowledge about Ecosystem services to let us know its benefits and service like food, air/soil quality, and biodiversity, which are really important in Landscape and our world. | |||
Provision services (Plants), Regulation service (air, water purification and water regulation) Supporting service (Nutrient cycling, soil formation, photosynthesis) and Cultural services (recreation, cultural heritage and health (mental and physical)). | |||
== B.5 References == | == B.5 References == | ||
* ''give a full list of the references you have used for this section'' | * ''give a full list of the references you have used for this section'' | ||
https://www.bikemap.net/en/l/2790150/ | |||
http://www.maplandia.com/belgium/vlaanderen/west-vlaanderen/nieuwpoort/ | |||
https://www.airbnb.com/ | |||
https://www.openstreetmap.org/#map=14/51.1324/2.7286 | |||
https://www.viamichelin.com/web/Tourist-Attractions?geoboundaries=51.0603324,2.6468897:51.0756501,2.694912 | |||
https://www.wikiwand.com/en/Nieuwpoort,_Belgium | |||
https://www.statista.com/statistics/529360/share-of-belgian-population-at-risk-of-poverty/ | |||
https://www.numbeo.com/cost-of-living | |||
https://www.citypopulation.de/php/belgium-westvlaanderen.php?cityid=38016 | |||
Steunpunt data & analyse 2017 | |||
=Phase C – Strategy and Master Plan = | =Phase C – Strategy and Master Plan = | ||
== C.1 Goal Setting == | == C.1 Goal Setting == | ||
*'' | *''Concept: Green R.I.N.G Resilient Ingenuity as a Natural Guardian | ||
*'' | Strategic planning objectives: | ||
1. First of all, we want to enhance the green soft surfaces & wetlands to mitigate the flood vulnerable areas in the city. | |||
2. Secondly, it is very important to make connectivity between the green spaces to make the green ring to provide a healthy environment & serve the lives on land | |||
3. Connecting the protected areas of Nieuwpoort to promote the biodiversity of that area. | |||
4. Connecting the districts with pedestrian and bike paths'' | |||
* ''Analysing the objectives, we have set four major goals from the list of sustainable development goals. They are 3 Good Health and Well-being, 11 Sustainable Cities and Communities, 13 Climate Action and 15 Life on Land. The first objective would help to protect the city from the flood in order to serve the climate action goal & life on land. The urban greenery objective is related to meet our all goals. Connecting the protected areas of Nieuwpoort to promote the biodiversity of that area would help to achieve the goal of lives on land. In addition, develop recreational infrastructures which contain touristic trail with walkway & bike path to achieve the sustainable city & communities. '' | |||
<gallery caption=" " widths="500px" heights="200px" perrow="1"> | <gallery caption=" " widths="500px" heights="200px" perrow="1"> | ||
File: | File:Goals Z.png|''add caption here'' | ||
</gallery> | </gallery> | ||
== C. | == C.2 Spatial Strategy and Transect == | ||
*'' | *'' To achieve our vision, we want to use the natural elements of the landscape (naturally shaped waterways, wetlands, dunes) to create a resilient city. In the concept map, illustration 3 zones are identified to intervene in our ideas. Connecting the green spaces to create a green ring around Nieuwpoort following the guideline of Natura 2000. Those 3 zones would be connected through a touristic trail with bike path & walkway. Moreover, it's also our goal to connect the birds & habitat protected areas to enhance biodiversity. '' | ||
<gallery caption=" " widths="800px" heights="500px" perrow="1"> | |||
File:Concept Map 1.png|''Concept Map'' | |||
File:Transect n.png|''Nieuwpoort Transect'' | |||
File:design1.png|''Design Site 1 of the Niewpoort Green RING Project achieves a number of the goals laid out in our concept: Connecting protected areas, Mitigating the effects of coastal flooding, building up biodiversity in the district and establishing pedestrian and bicycle paths to connect key points in the district, such as Natura 2000 sites, the old town, residential corridors and the seasonal holiday park.'' | |||
File:design1view.png|''Urban wetland parks build capital through a number of different ways.'' | |||
File:GI-for_wiki.jpg|''Design Site 2 of the Niewpoort Green RING Project shows some of the key aspects mentioned in our concept: 1.focus on preserving the protection areas which leads to the connection of the prominent nature reserve Lake Koolhofput with the old town of Nieuwpoort. Also 2.increasing biodiversity in the lake surrounding : creating two wetland parks and a forest next to these parks. 3.To increase more recreational infrastructures in Nieuwpoort south, the lake, wetland parks and the forest are interlinked by pedestrian and bicycle paths. And then the link further extends to the old town in the north with the already existing city initiatives like connecting the existing parks with the water channels around the old town.'' | |||
File:Proposed forest with lake .jpg|''The proposed forest will help in giving shade for recreation, offering biodiversity, and it can reintroduce a riparian forest to the landscape. With these proposed functions, like bird watching, jogging, boating, etc. the lake surrounding can be fully utilized by young people and nature lovers. | |||
<gallery caption=" " widths="500px" heights="200px" perrow="1"> | <gallery caption=" " widths="500px" heights="200px" perrow="1"> | ||
File: | File:PARTNERSHIP and GOVERNANCE DESIGN 01.png|''Partnerships/Governance model'' | ||
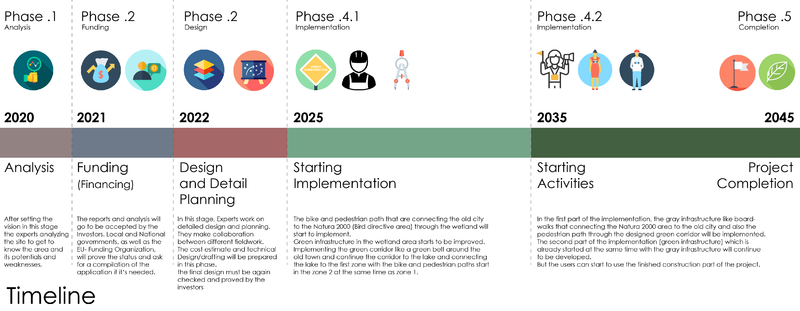
File: | File:TimelineA1.png|''Phase 1. ANALYSIS: After setting the vision in this stage the experts analyzing the site to get to know the area and its potentials and weaknesses. Phase 2. FUNDING: The reports and analysis will go to be accepted by the Investors. Local and National governments, as well as the EU- Funding Organization, will prove the status and ask for a compilation of the application if it‘s needed. Phase 3. DESIGN: In this stage, Experts work on detailed design and planning. They make collaboration between different fieldwork. The cost estimate and technical Design/drafting will be prepared in this phase. The final design must be again checked and proved by the investors. Phase 4.1. IMPLEMENTATION: The bike and pedestrian path that are connecting the old city to the Natura 2000 (Bird directive area) through the wetland will start to implement.The green infrastructure in the wetland area starts to be improved. Implementing the green corridor like a green belt around the old town and continue the corridor to the lake and connecting the lake to the first zone with the bike and pedestrian paths start in the zone 2 at the same time as zone 1. Phase 4.2. In the first part of the implementation, the gray infrastructure like boardwalks that connecting the Natura 2000 area to the old city and also the pedestrian path through the designed green corridor will be implemented. The second part of the implementation (green infrastructure) which is already started at the same time with the gray infrastructure will continue to be developed. But the users can start to use the finished construction part of the project. Phase 5. PROJECT COMPLETION'' | ||
</gallery> | </gallery> | ||
| Line 284: | Line 303: | ||
= D. Process Reflection = | = D. Process Reflection = | ||
The session of 2020 Coland seminar delivered a wide range of information and diverse types of landscape information about the coastal landscape to us. As our whole group is currently studying masters of landscape architecture so most of the part of the study we feel very challenging. | |||
As we didn’t know before about the coastal landscape condition of the Belgian coast area so the whole task is very interesting for us. We learned about the typology and condition of the coastal landscape of Belgium. It’s not just about the location we studied but as a part of our study we did so many cases studied and it developed our perception about coastal landscapes of the European Union. | |||
The course helped us to learn about various skills to see the landscape in different ways and analyze it by using different methods. For our group, most of the sessions were easy to follow but very few of them were a little confusing for us to understand as the lack of knowledge and theory. | |||
Another thing is that we had a great combination on our team as we did one year of master’s course together so we had a better understanding to each other which helped us to divide our takes and also work as a team. This team power encourages us to analyze deeply on our study site and revel all the aspects and importance of the study area. | |||
The biggest limits for our team were that we were unable to visit the location physically which actually necessary for the design. It’s also very helpful for a better analysis, especially to go on field trips, to collect data directly from the locals what we're unable to do but we tried our best to find all the existing current documents from the internet. | |||
In the end, we would link to say maybe we didn’t learn everything about a coastal landscape because it’s a vast topic to understand but for our team, it was a great experience and it will help us to study more about the coastal landscape in our future studies. | |||
Latest revision as of 15:43, 15 April 2020
>>>back to working groups overview
| Area | Nieuwpoort | |
| Place | Flemish Region | |
| Country | Belgium | |
| Topics | please enter the main coast-related topics here | |
| Author(s) | Nafiz Rahat , Foysal Karim, Nicolas Reibel, Rahnuma Ahmad Tahiti, S.Amir H.Shahrestani
| |

| ||
Rationale
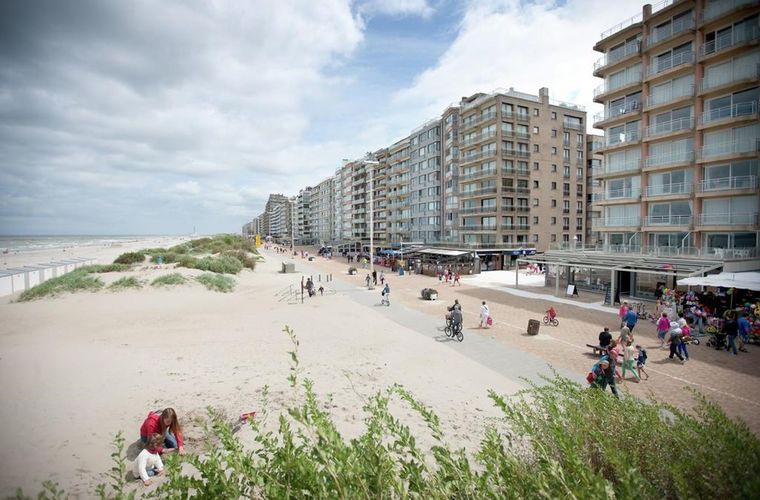
- The Flemish Nieuwpoort, a small town situated along the Belgian coast, at the mouth of the Yser River, on the North Sea. Nieuwpoort is widely known amongst its European neighbors for its rich offerings for tourism. The town also has a thousand years of history, which is reflected in its landmarks & monuments. Therefore, its tourism-based economy has a large impact on Nieuwpoort’s coastal landscape & natural environment. The objective of this project is to create a responsive landscape design that enhances the local economy & ecology without impacting its cultural heritage.
- Nieuwpoort, Belgian Coastal Area, Tourism-based Economy, Protected Areas, Public Art, Living Waters
Location and scope
You can edit this map with the map editor
A Landscape System Analysis
A.1 Landscape layers and their system context
Geomorphology, landscape units and coastal typology
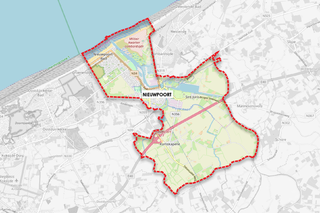
- The Flemish Nieuwpoort is a seaside low coast area in the West Flanders. The land formation of this low coast area results in a combination of sediments & sands. Which is generated by the process of sea waves & the current . In addition, sea shorelines of Nieuwpoort arranging with the settlements, some parts of the coast are covered with natural grasslands. Estuary of the Yser river has a very important impact on the landscape of Nieuwpoort, the river directly connected with the see & divided into five branches from the point of De Ganzepoot. The city consists of two parts: Nieuwpoort-Stadt and Nieuwpoort-Bad. Wide sandy beach, the combination of sun & sea have added the value of tourism, one of the major factor of this place.
-
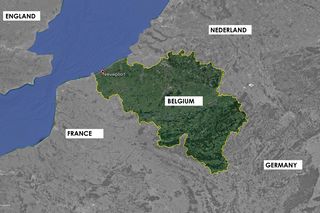 Nieuwpoort, Belgium
 -
 Nieuwpoort


Land use
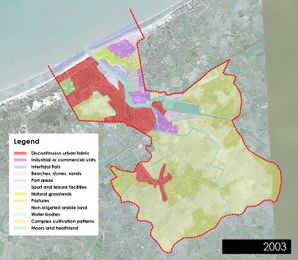
The land-use of Nieuwpoort has included some different uses. As we can see on the map the major Landuse in the Nieuwpoort belongs to the agriculture and green spaces, almost in the south part of the city. The Red areas on the map are Settlements which located in the west of the Nieuwpoort. The Yellow areas show agriculture and green spaces such as pastures and natural grasslands. The blue lines and areas are waterbody and rivers, which is giving different identities to the city, and it has lots of potentials. The Violet color zones are the industry/commercial places. The sports and leisure facilities are shown in the white color. As it's visible in two maps (land use 2003 and 2012) we cannot see so many differences in the land use map, but what is visible is the settlement density changes. Due to the population growth and need of housing, and also tourism purpose city developed the housing area with high density, which shows us that in the near future the city needs more spaces for the development and we suppose that the next target will be the change of agriculture area to the settlement.
-
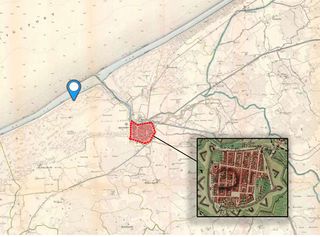 Land use around 1770
 -
 Land use 2003
 -
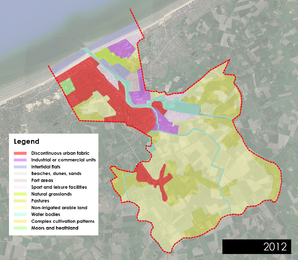 Land use 2012


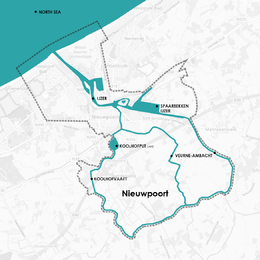
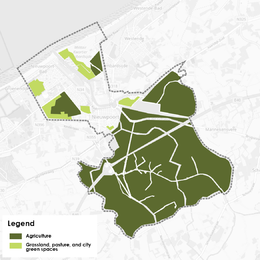
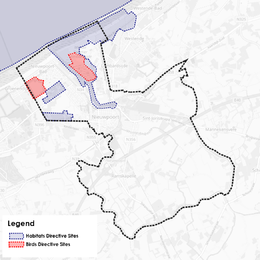
Green/blue infrastructure
The Ijzer river is crossing the city of Nieuwpoort and reaches the North sea. The KOOLHOFVAART and VEURNE-AMBACHT rivers, as well as IJZER river, are the blue infrastructure which are bringing lots of potentials into the city. The tourism and recreational infrastructure are benefited from them as well as agriculture. The Agricultures, natural grasslands, heathlands, pastures, and urban green spaces are the Green infrastructure of the city of Nieuwpoort. As we can see on the map of Natura 2000 (natural protected areas) map, in the north part of the city we have Habitats and Birds Directive Sites. the BLUE areas are under Habitats Directive and the RED areas are under Birds Directive (Protection Areas). The need for housing will bring the city to the stage of decision making to develop the settlement into agriculture. Due to climate change and sea-level rise, there is the possibility of mixing the Fresh-water with the Sea-water, which will badly affect the green infrastructure.
-
 Blue Infrastructure
 -
 Green Infrastructure
 -
 Natura 2000


Actors and stakeholders
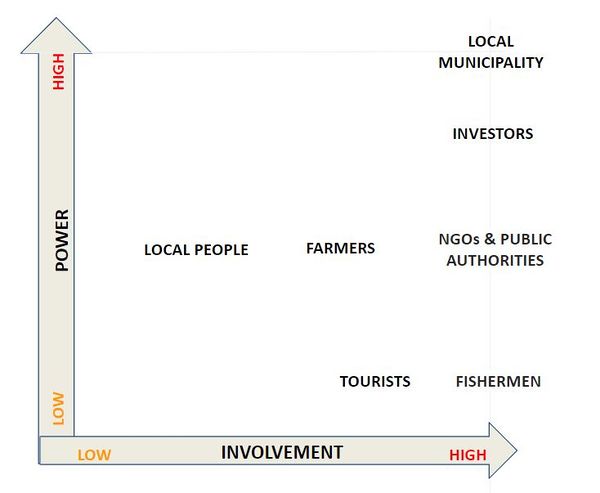
From the socio-economic condition of the study area Nieuwpoort, our analysis found three major type of actors who are most dominating in the landscape. Fishermen are one of them who have very significant involvement with the economy and landscape but they have very low amount of power. Fish market is mainly controlled by the local municipality and municipality have the most power and also high involvement in the area. NGO’s and some public authorities are working with the fisherman to improve and betterment of the fish market of the locality. They are also involve with the local municipality and mainly controlled by them. So from the power map they can define as middle in power with high involvement. Another group is the local farmers who are currently in a stable condition because of their direct connection with economy and landscape and they can define as middle of the power and involvement. Tourist have involvement with the landscape as they are visiting this place for few days but they are very low in power. On the other hand local people have average power because they are also controlled by the local authorities and for this reason their involvement is also low.
-
 POWER MAP

Sacred spaces and heritage
Aside from the existing natural elements in the Nieuwpoort region (the wide beaches, the Yser river and it’s estuary, dunes and grasslands) which are tied to community identity, there are three major built elements in the landscape that are of key importance to local heritage and sacredness.
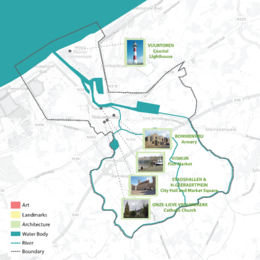
The first grouping is the architectural elements which are clustered in the old city with one outlier along the coast line. That outlier was the Vuurtoren, the coastal lighthouse, which guided boats into the harbor. Its first iteration was wooden, but was destroyed and rebuilt numerous times by the community. It’s current material is concrete, but it’s function, to keep the community safe, has not changed since the first one was first built in 1284.
Also keeping watch over the city has been the Onze-Lieve, Our Lady, Catholic Church, which was first constructed in 1163. This gothic church has been destroyed in multiple wars and rebuilt each time. Ironically, it houses a rare painting depicting the Battle of Nieuwpoort, from 1600.
The Bommenvrij, an old armory, the Stadshall and the church, even the lighthouse all signify the resilience of this landscape which has experienced much conflict throughout it’s history. The only architecture which succeeds at resisting a link to that identity is the Vismijn, the traditional fish market.
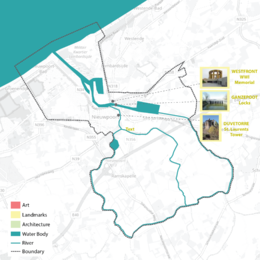
The next grouping of images, the landmarks, all carry on this link to the regions war torn past. The Duvetorre, once the St. Laurents Tower, was destroyed by war but never rebuilt. It keeps its relevance to the community by it’s association with the notorious Jean DePanne, an accused witch, who was know to use the space for devil worship. The Ganzepoot, which for most would appear to be a functional piece of infrastructure for managing water levels, was actually the tool used to stave off the Germans during WW I when a local citizen open the channel to flood the landscape, ultimately halting the advancing German army and saving the town. And the last landmark image, the Westfront, is actually a war memorial to that exact event.
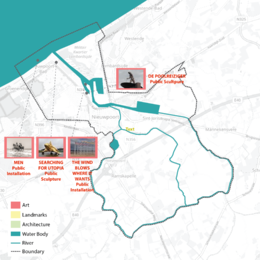
However, the ties to heritage do not always determine community identity or correlate to the spaces that signify sacredness. Public sculpture, especially site specific art installations, are the essence of sacredness as they tie imagery and symbolism into the landscape through deeper concepts. The object tap into the landscape itself, while bringing new meaning with them by introducing new symbols. In Nieuwpoort there are four sculptural installations that root themselves in the landscape. The work by Jan Fabre in the image below ties itself to the horizon with a title that is both forward looking and optimistic. The work Men is placed in the tidal zone, so as to make the work seem almost dynamic, as it plays with the sea level on a daily basis. Oriented towards the town itself, it plays off a completely different energy than the Jan Fabre work.
There are two other works in the city, both are places around the harbor. The first, The Wind Blows Where it Wants is unique in that it is able to visualize a force that actually drives the landscape, the wind that forms the dunes. It gives body to a dynamic, powerful yet nearly invisible force that is a constant for coastal communities, by placing hundreds of flags in a space where the community is very likely to experience it. The last work De Poolreiziger is a work dedicated to a contemporary Belgian polar explorer who was also a citizen of the Nieuwpoort community.
In many ways, these structures evoke the experiences and values this community has at times in its history expressed or even absorbed in its present day.
-
 A map locating the architecture in the landscape which is tied to heritage, sacredness and identity
 -
 A map locating the landmarks in the landscape which are tied to heritage, sacredness and identity
 -
 A map locating the art in the landscape which is tied to heritage, sacredness and identity


-
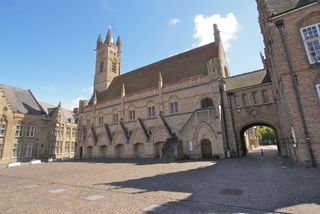 Belfort en Halle The bell tower in the Nieuwpoort city hall, a UNESCO World Heritage site, sits atop a nearly 600 year old structure that was completely destroyed in WW I and later rebuilt. It signifies community and resilience.
 -
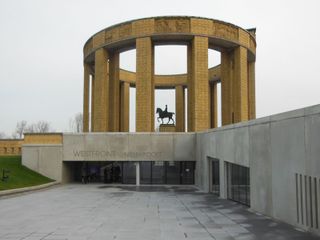 Westfront This WW I memorial is one of seven that incorporates a monument to Albert I, the Soldier King. It is strategically placed adjacent to the Ganzepoot locks on the Yser river, which were the key to preserving the country from complete German occupation during one of the war's major battles.
 -
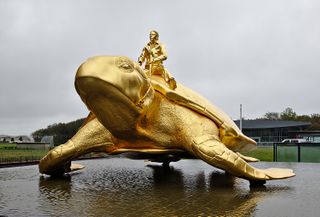 Searching for Utopia This sculpture, by world famous Belgian artist Jan Fabre, was installed at its site on the shoreline so that the gaze of the figure is looking out to sea at the horizon. Site specific installations of sculpture integrate landscape elements into their concept, embedding them into landscape identity.


Visual appearance and landscape narrative
- Prince Maurice at the Battle of Nieuwpoort, the painting was made on the time of Eighty years which is known as the Dutch war of independence. On 2 July 1600, on the command of Maurice of Nassau and Francis Vere, this battle happened near the city of Nieuwpoort. Famous painter Pauwels van Hillegaert who is known as a Dutch Golden Age painter of landscapes and military scene has painted this Battle of Nieuwpoort which actually reminds a history of this area.
- A Belgian artist named Alfred Bastien painted The channel in Nieuwpoort, which deliver a message about one of the important landscape character of this area. As the area is characterized by its coastal landscape but some of the channels are also significant to maintaining the landscape values.
- The Sea Beggars by Cecelia Holland, A historical novel about the preliminary stages of the Eighty Years' War (Dutch War of Independence). In this historic novel, in a part of the plot, it talks about the area of Nieuwpoort. The actual history of the conflict is long and complex, but Holland tells an insightful, if a small, slice of a much bigger picture, through the stories of one Dutch family.
-
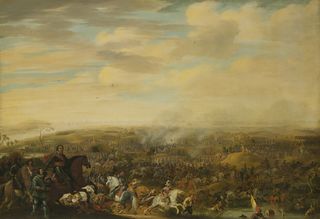 Prince Maurice at the Battle of Nieuwpoort by Pauwels van Hillegaert.
 -
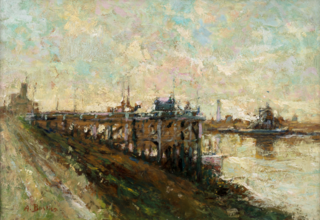 The channel in Nieuwpoort by Alfred Bastien
 -
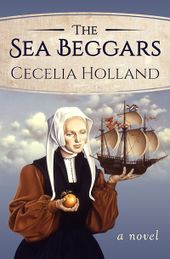 The sea beggars by Cecelia Holland


A.2 Summary of your landscape system analysis and your development targets
- Link back to the Sustainable Development Goals: Which goals are at risk?
- What is your hypothesis for this landscape?
- Visualise your hypothesis with one graphic/pict
- Are there any existing initiatives taking action in this landscape? Do you have a critical perspective on that?
- Add text and visuals


-
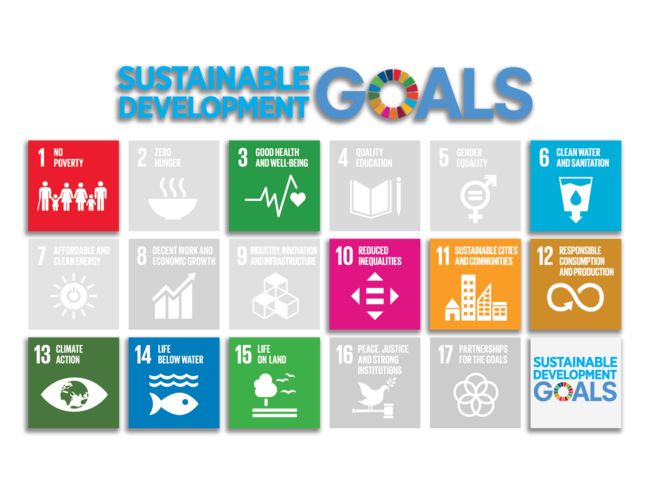 We defined four drivers for the site that we are working on, Tourism, housing, coastal flooding, and ecological protection. These four drivers have the pressures and impacts on the city of Nieuwpoort such as traffic congestion, reduced agriculture land, and green spaces, property damage, beach and estuary erosion, and rising living costs, lower quality living standards, and damaged ecology, and etc. Because of them, there are at least nine goals of the UN sustainable development goals at risk
 -
 Current Situation
 -
 Future - The current coastline is already under pressure from intense tourism, which doubles the population of the city in the summer season. This influx has overinflated the housing market and the cost of living in Nieuwpoort, making it the most expensive region in Belgium to buy an apartment. Should the seasonal population boom continue at the same rate, the poverty gap will continue to widen and price many workers out of the housing market. In addition, a continued rise in the housing market valuations will inflate all real-estate rates, ultimately inflating the cost of living. To lessen this impact, pressure on green infrastructure and agricultural land will be the result of developers seeking out new opportunities to cash in. The resulting supporting infrastructure will add to air and water pollution while causing the ultimate loss of the valuable coastal estuary along the Yser river. Intensive coastal flooding due to climate shift will also damage the coastal estuary, ultimately leaving a less picturesque landscape and creating millions in property damage along the way. This series of events may result in tourism finally decreasing and the economy of the region losing it’s valued stability.


A.3 Theory reflection
Belgian National Adaptation Plan 2017 - 2020
Due to the reason of climate change effect and changing socio-economic condition of the Nieuwpoort costal area, few measures form Belgian National Adaptation Plan 2017 – 2020 need to be count. From out studies we can ensure that the Measure 1 (Development of high resolution climate scenarios for Belgium), Measure 7 (Evaluation of the socio-economic impacts of climate change in Belgium) and Measure 8 (Take climate change impacts and adaptation needs into account in the framework of the future National Environmental Health Action Plan -NEHAP) are directly and also indirectly involved in our study area (Nieuwpoort).
European Document Natura 2000
Natura 2000 framework exited more than 20 years for the protection of species. In most protected areas, an acceptable balance is always sought between the demands of the local people and the animals and plants to be protected. There are also policies for landowners, users, admirations to formulate the usage of agricultural field, water, forestry for hunting. In addition, it also provides directional guidelines of leisure and recreational purposes. Those measures can be implemented in changing the socio-economic condition of the Nieuwpoort coastal area
Ramsar International Convention on Wetlands 1975 - 2020
The Ramsar Convention on Wetlands of International Importance, which takes its name from the Iranian city where the convention was first signed in 1971, is a global treaty focusing on key areas of waterfowl habitat. Almost 90% of UN member states are a part of the Ramsar Convention.
Belgium currently has nine Ramsar sites totaling nearly 47,000 hectares of designated wetland. Three sites are located on the Belgian coast, with just one located in the North Sea itself. That particular 1900 hectar site, called Vlaamse Banken, is located on the coastal territory of Nieuwpoort. It includes both a beach zone and marine waters that contain a series of coastal banks that are key bird habitat. Designated in 1986, it has been listed as a Ramsar site for 35 years.
Wintering grebes and sea-ducks call this area home, while a number of shorebird species also include this habitat in their winter foraging and roosting zones. Commercial fishing, recreation and sand and gravel extraction are a threat to this environment.
A.4 References
IMAGES
Marc Ryckaert 2004. Nieuwpoort vuurtoren https://de.wikipedia.org/wiki/Datei:Nieuwpoort_vuurtoren.jpg Michel wal November 2012 Nieuwpoort Vismijn 1202 https://commons.wikimedia.org/wiki/File:Nieuwpoort_vismijn_1202.JPG Frans90245 2017-04-03 Veurne Ambacht frontaal gezien https://nl.wikipedia.org/wiki/Overlaat_van_Veurne-Ambacht#/media/Bestand:Veurne_Ambacht_frontaal_gezien.jpg Frans90245 December 2014 Bezoekerscentrum Westfront 01 https://commons.wikimedia.org/wiki/File:Bezoekerscentrum_Westfront_01.jpg Paul Hermans October 2017 Onze-Lieve-Vrouwekerk https://commons.wikimedia.org/wiki/File:Onze-Lieve-Vrouwekerk_(Nieuwpoort)_26-10-2017_10-55-38.JPG Michel wal March 2012 Nieuwpoort Duvetorre 1201 https://commons.wikimedia.org/wiki/File:Nieuwpoort_Duvetorre_1201.jpg Frans90245 2016-09-20 Bommevrij 2 https://nl.wikipedia.org/wiki/Bommevrij#/media/Bestand:Bommevrij_2.jpg flamenc May 2010 Belfort en Halle https://commons.wikimedia.org/wiki/File:Nieuwpoort_-_Belfort_en_Halle.jpg March 2009. Daniel Burien. Beaufort 03 https://danielburen.com/images/exhibit/1674?ref=group&year=2009#lg=1&slide=1 https://commons.wikimedia.org/wiki/File:Poolreiziger_02.jpg Frans90245. 27 February 2014. Poolreiziger Frans Keustermans. May 29, 2018. Men - Beaufort 2018 Nieuwpoort - Belgium https://www.flickr.com/photos/141492153@N02/28802619368 Benoit Bruer. 2018-09-12. Searching for Utopia, Nieuwpoort https://www.wikidata.org/wiki/Q51174201#/media/File:Searching_for_Utopia,_Nieuwpoort_(DSCF9856).jpg
CONTENT
https://nl.m.wikipedia.org/wiki/Onze-Lieve-Vrouwekerk_(Nieuwpoort) https://www.nieuwpoort.be/nieuwpoort/view/en/nieuwpoort/the_great_war/westfront_nieuwpoort https://nl.m.wikipedia.org/wiki/Vuurtoren_van_Nieuwpoort https://en.wikipedia.org/wiki/Ramsar_Convention
MAPS
https://mapire.eu/en/geoname/belgium/nieuwpoort-bad-2790149/
https://en.wikipedia.org/wiki/Nieuwpoort,_Belgium#/media/File:Nieuwpoort,_Belgium_;_Ferraris_Map.jpg
https://land.copernicus.eu/pan-european/corine-land-cover/clc2018
https://www.openstreetmap.org/#map=14/51.1324/2.7286
https://natura2000.eea.europa.eu/
Phase B: Landscape Evaluation and Assessment
B.1 Assessment Strategy
In our landscape system analysis, we discussed four main drivers (Tourism, housing, coastal flooding, and ecological protection) which are more dominating for this particular study area. So based on our previous analysis we found some issues like traffic congestion, reduced agriculture land, and green spaces, property damage, flooding, beach and estuary erosion, and rising living costs, lower quality living standards, and damaged ecology, etc which are some of the important factors and we think these are needs to be considered for our mapping assessment. The excessive pressure of tourism creating an impact on the landscape and also it's increasing the rate of living cost. Low-cost housing areas are also getting denser for lower-income level people who are trying to get into the area. And when a place gets more populated it automatically creates mass with the public transportation system. So Accommodation facilities and transportation maps are made which show the connectivity of the whole area. Also, the economic condition of the public is shown on another map for understating about their living condition. To analyze the current situation of tourism facilities with recreational activity, green infrastructure is mapped which shows the current location of recreational zones and relation to the public life and coastal landscape. From various man-made issues and also form pollution causes climate change which is also a reason for sea-level rise. It’s a major problem of the study area which can be affected by serious flooding. Agricultural land can be washed away by any serious flooding issue so in our mapping, coastal flooding is also included which shows how it’s affecting the local landscape and ecosystem services.
B.2 Mapping
- As defined by your assessment strategy you conduct the mapping and present your findings here
- As a minimum, at least three different themes need to be mapped, you may choose more if needed
-
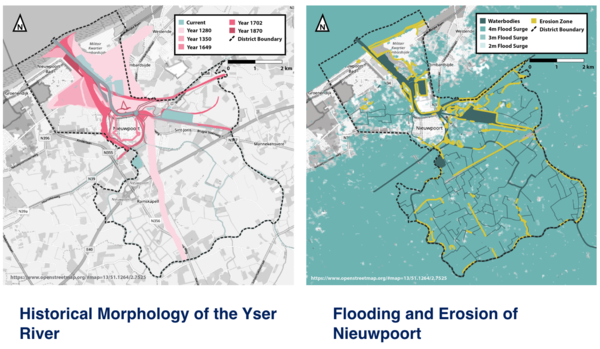 A time-based approach to mapping the physical changes in the shaping of the Yser River where it meets the North Sea gives a clearer picture of how the current landscape was formed. Studying these changes gives insight in to how the landscape may revert back to a sustainable ecological balance, through it’s own natural function or through the assistance of the state. In as much as the image on the left looks back, the image on the right is more of a forward projection. It visualizes the areas prone to flooding in a 4m storm surge and also points out the particular points along the shore line that are most susceptible to erosion. This information will allow for the any future projects to mitigate for the effects of flooding in particular areas, while studying where erosion may cause harm, or play a beneficial role, in the reforming of the landscape. In general, it is a better understanding of a very dynamic system that can have profound effects on communities and proposed planning and design.
 -
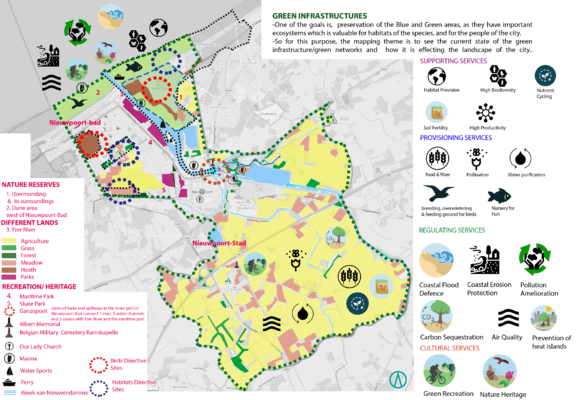 One of the prominent features of Nieuwpoort are the nature reserve of Ijzermonding and the dune area in the north western side. The ecosystem of ijermonding is unique on the flemish coast, here a river estuary connects with the beach, sea dunes and dune grasslands. Two Bird directive areas 'West coast' (BE2500121) and 'Het Zwin' (BE2501033) also fall inside these areas. The main Green infrastructures of Nieuwpoort are Agricultural lands, Meadows, Heaths and Grasslands. The agricultural lands cover almost the majority of the area in the southern part of the city Nieuwpoort Stad. A small amount of forest areas are present. The Yser river plays a prominent role around these green Infrastructures. Here through the lock and spillways entry point, Ganzepoot, one river, three water channels and two canals are connected with the mouth of the Yser River and the maritime port. So this is quite an important connection point. There is the potential to develop the area around the historic core of the city, close to Ganzepot, for recreation and nature green. In the Beach side and in the mouth of the Yser river and the canals, a number of water sports activities can be seen. There is the potential to develop a green belt along the bird directive sites and habitat directive sites to resist urban growth of industries or Grey infrastructures around these valuable areas.Also the city has a number of old heritage sites, which needs more exposure, so there is this loss of identity despite the presence of all these ancient monuments. The nature reserve areas in the northern part are an important part of the Cultural Heritage of Nieuwpoort. Hence to lessen the pressure on these protected areas, and for lesser anthropocentric activities in the beach side, there should be more Green recreational infrastructures such as urban open spaces in the southern part of the city.
 -
 As Nieuwpoort is place for tourist attraction so it’s a important matter to identify the hot spots of attarction and also the connection with all those areas. In left side map shows some important recreational spaces which also serves as touristic attraction and the map also shows the bus stops so that we can see the connectivity through the whole area. Also bike paths are visible in the map which connect Nieuwpoort to other locations. It’s important to think about the accommodation facilities for tourists so Air bnb, hotels and camping places are also locate in the right side map which will give better understanding about how much accommodation facilities this area can provide for visitors.
 -
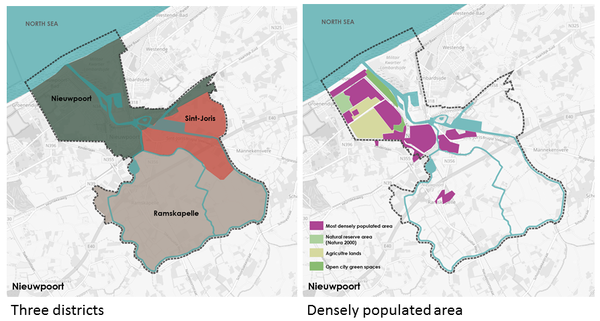 The city is divided into the 3 parts, but the densely populated area is in the northern part. It shows the interest of the housing development was the north (closet to the beach), and also we can see the green spaces among the settlements in this district are going to be smaller and in near future this green land uses will change to the settlement which will be needed. In the southern part of the city, there is potential for housing development.
 -
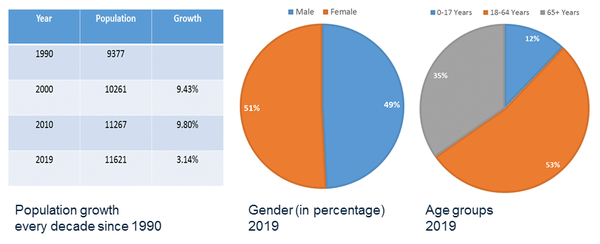 The City is facing population growth, as we can see in the last decades the city was welcoming more people, but if we look at other graphs like age groups, we realize that the population is going to be old, then the city needs to be developed in the way to bring the infrastructures which can answer the elderly people's needs.
 -
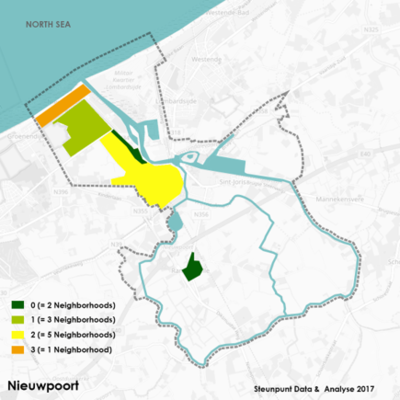 Economy & social condition These problems are bundled into 4 major themes (dimensions): demography, housing, education and unemployment.This is the poverty map which is assessed on the scale of 0-4. 4 is the less good economic condition 0 is a better economic condition. (0=2) green depicts this score is for 2 neighborhood (1=3) for 3 neighborhood, (2=5) for 5 neighborhood, (3=1) for 1 neighborhood


B.3 Problem definition and priority setting
- Give a summary of the major findings of your mapping process, what are the problems/potentials identified?
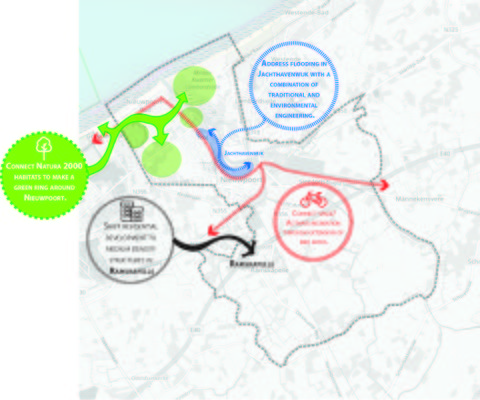
- First priority is to enhance the green infrastructure by Connecting Natura 2000 habitats to make a green ring around Nieuwpoort. Secondly, relocate the residential development to medium density structures in Ramskapelle following the. Enhance the sustainable mobility bicycle path to connect the recreational open spaces. In addition, Address flooding in Jachthavenwijk & create a possible idealistic solution with the combination of traditional and environmental engineering.
-
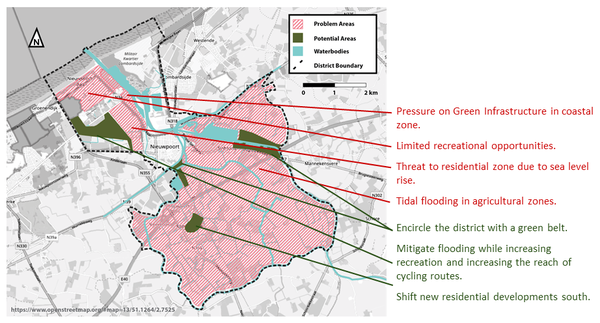 Overlaying the themed maps from above, we were able to locate particular zones which will be affected by a number of factors. In the south, the agricultural land is susceptible to leaching and contamination of both ground water and river waters through the transfer of salts and pesticides during storm surge flooding. However, it was the densely populated area near the shoreline that posed the most problems, and rightfully, potentials. The limited amount of recreational space and green infrastructure designated for ecology in the Northwest is compounded by the influx of tourism that overwhelms these sights. Additionally, the housing zone between the old town and the coast is at a high risk of health and economic harm due to potential flooding. There is great potential to protect housing and economy while expanding recreation and protecting it’s ecological function by shifting new residential development and introducing a green belt to he area. Both natural and engineered solutions to mitigate flooding could be paired with this approach.
 -
 add caption here


B.4 Theory reflection
Observation, visiting the site and survey and interview stakeholders could help us get to know the situation better. It would have been beneficial if the information was available to apply our demographic data spatially.
Of course, the Steinitz Framework could help us to find the clue, asking ourselves how we can describe the area of study, or what is the current situation to get to know the problems and risks, and potential as well. For the analysis part, we use old maps which could show us how the city developed, we could realize how the city changed. Reading the history of the city and the north sea opened our eyes to the culture and the people's needs. Having knowledge of Green infrastructure and its important role in climate change and in nature and human life as well. The mapping of economic status and housing overlaid with the mapping of preserved green spaces and the dynamics of the blue infrastructure has allowed us insight into the relationships between the specific challenges our data has revealed. Getting the knowledge about Ecosystem services to let us know its benefits and service like food, air/soil quality, and biodiversity, which are really important in Landscape and our world. Provision services (Plants), Regulation service (air, water purification and water regulation) Supporting service (Nutrient cycling, soil formation, photosynthesis) and Cultural services (recreation, cultural heritage and health (mental and physical)).
B.5 References
- give a full list of the references you have used for this section
https://www.bikemap.net/en/l/2790150/ http://www.maplandia.com/belgium/vlaanderen/west-vlaanderen/nieuwpoort/ https://www.airbnb.com/ https://www.openstreetmap.org/#map=14/51.1324/2.7286 https://www.viamichelin.com/web/Tourist-Attractions?geoboundaries=51.0603324,2.6468897:51.0756501,2.694912 https://www.wikiwand.com/en/Nieuwpoort,_Belgium https://www.statista.com/statistics/529360/share-of-belgian-population-at-risk-of-poverty/ https://www.numbeo.com/cost-of-living https://www.citypopulation.de/php/belgium-westvlaanderen.php?cityid=38016 Steunpunt data & analyse 2017
Phase C – Strategy and Master Plan
C.1 Goal Setting
- Concept: Green R.I.N.G Resilient Ingenuity as a Natural Guardian
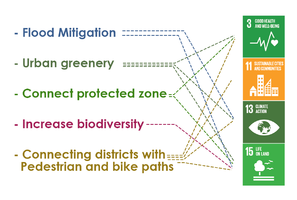
Strategic planning objectives: 1. First of all, we want to enhance the green soft surfaces & wetlands to mitigate the flood vulnerable areas in the city. 2. Secondly, it is very important to make connectivity between the green spaces to make the green ring to provide a healthy environment & serve the lives on land 3. Connecting the protected areas of Nieuwpoort to promote the biodiversity of that area. 4. Connecting the districts with pedestrian and bike paths
- Analysing the objectives, we have set four major goals from the list of sustainable development goals. They are 3 Good Health and Well-being, 11 Sustainable Cities and Communities, 13 Climate Action and 15 Life on Land. The first objective would help to protect the city from the flood in order to serve the climate action goal & life on land. The urban greenery objective is related to meet our all goals. Connecting the protected areas of Nieuwpoort to promote the biodiversity of that area would help to achieve the goal of lives on land. In addition, develop recreational infrastructures which contain touristic trail with walkway & bike path to achieve the sustainable city & communities.
-
 add caption here

C.2 Spatial Strategy and Transect
- To achieve our vision, we want to use the natural elements of the landscape (naturally shaped waterways, wetlands, dunes) to create a resilient city. In the concept map, illustration 3 zones are identified to intervene in our ideas. Connecting the green spaces to create a green ring around Nieuwpoort following the guideline of Natura 2000. Those 3 zones would be connected through a touristic trail with bike path & walkway. Moreover, it's also our goal to connect the birds & habitat protected areas to enhance biodiversity.
-
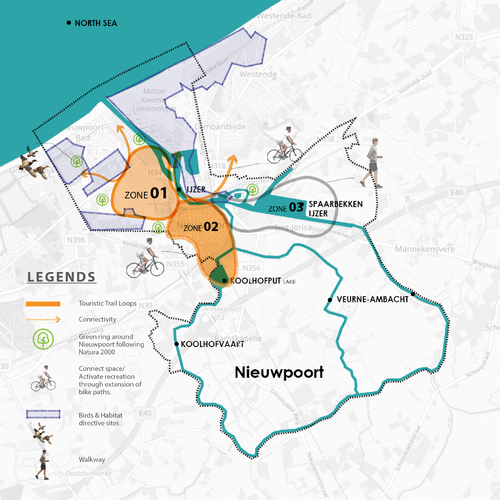 Concept Map
 -
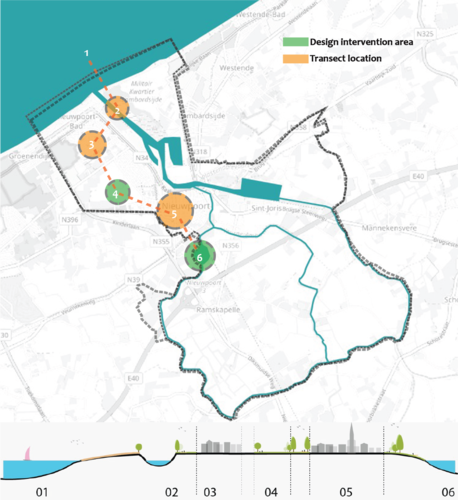 Nieuwpoort Transect
 -
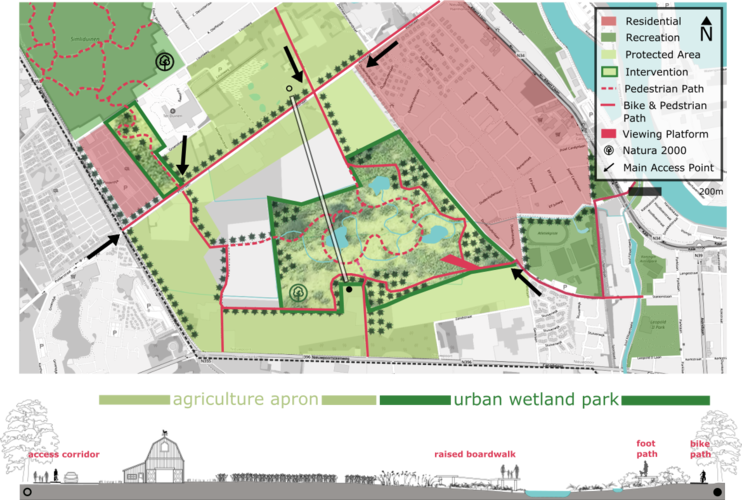 Design Site 1 of the Niewpoort Green RING Project achieves a number of the goals laid out in our concept: Connecting protected areas, Mitigating the effects of coastal flooding, building up biodiversity in the district and establishing pedestrian and bicycle paths to connect key points in the district, such as Natura 2000 sites, the old town, residential corridors and the seasonal holiday park.
 -
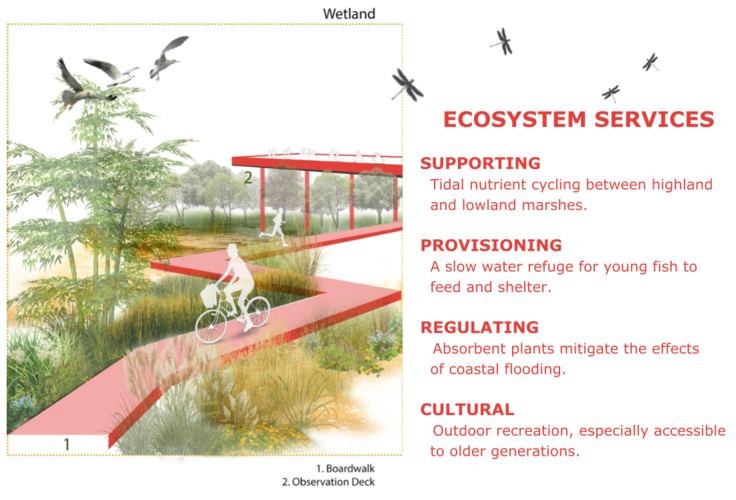 Urban wetland parks build capital through a number of different ways.
 -
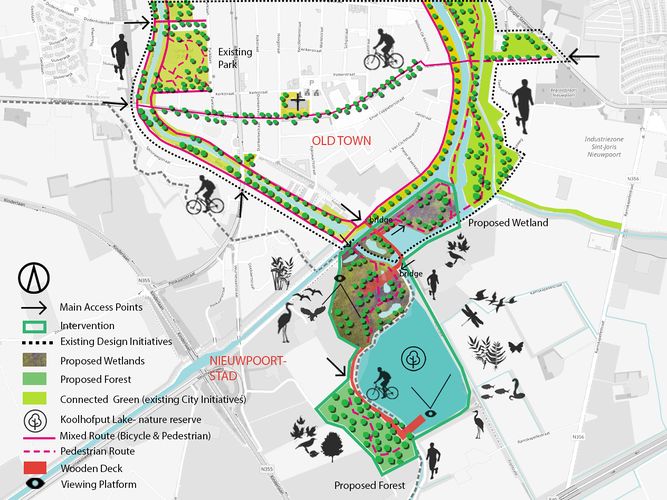 Design Site 2 of the Niewpoort Green RING Project shows some of the key aspects mentioned in our concept: 1.focus on preserving the protection areas which leads to the connection of the prominent nature reserve Lake Koolhofput with the old town of Nieuwpoort. Also 2.increasing biodiversity in the lake surrounding : creating two wetland parks and a forest next to these parks. 3.To increase more recreational infrastructures in Nieuwpoort south, the lake, wetland parks and the forest are interlinked by pedestrian and bicycle paths. And then the link further extends to the old town in the north with the already existing city initiatives like connecting the existing parks with the water channels around the old town.
 -
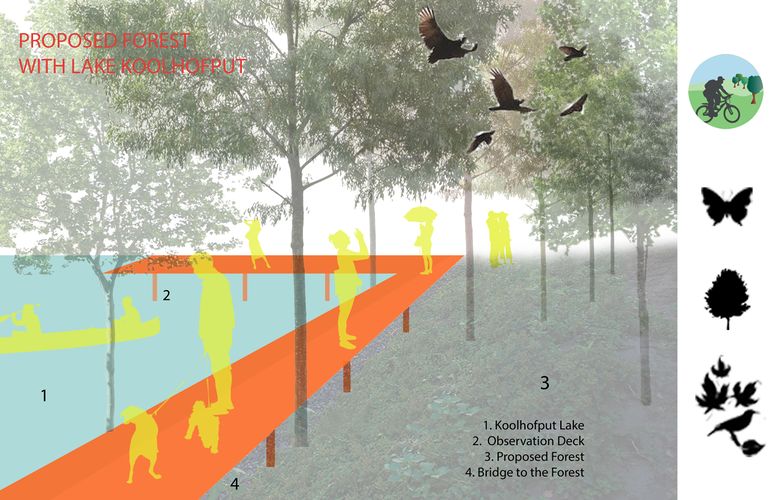 The proposed forest will help in giving shade for recreation, offering biodiversity, and it can reintroduce a riparian forest to the landscape. With these proposed functions, like bird watching, jogging, boating, etc. the lake surrounding can be fully utilized by young people and nature lovers.
 -
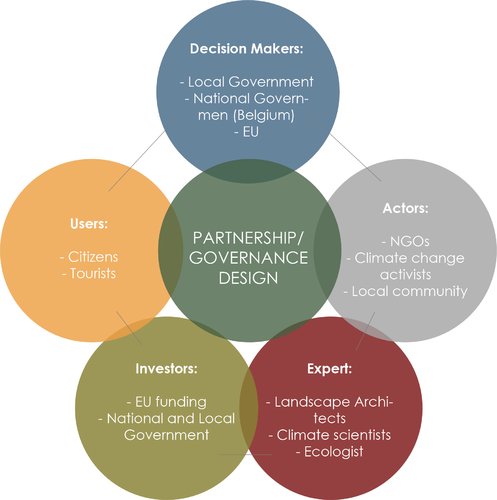 Partnerships/Governance model
 -
 Phase 1. ANALYSIS: After setting the vision in this stage the experts analyzing the site to get to know the area and its potentials and weaknesses. Phase 2. FUNDING: The reports and analysis will go to be accepted by the Investors. Local and National governments, as well as the EU- Funding Organization, will prove the status and ask for a compilation of the application if it‘s needed. Phase 3. DESIGN: In this stage, Experts work on detailed design and planning. They make collaboration between different fieldwork. The cost estimate and technical Design/drafting will be prepared in this phase. The final design must be again checked and proved by the investors. Phase 4.1. IMPLEMENTATION: The bike and pedestrian path that are connecting the old city to the Natura 2000 (Bird directive area) through the wetland will start to implement.The green infrastructure in the wetland area starts to be improved. Implementing the green corridor like a green belt around the old town and continue the corridor to the lake and connecting the lake to the first zone with the bike and pedestrian paths start in the zone 2 at the same time as zone 1. Phase 4.2. In the first part of the implementation, the gray infrastructure like boardwalks that connecting the Natura 2000 area to the old city and also the pedestrian path through the designed green corridor will be implemented. The second part of the implementation (green infrastructure) which is already started at the same time with the gray infrastructure will continue to be developed. But the users can start to use the finished construction part of the project. Phase 5. PROJECT COMPLETION


_26-10-2017_10-55-38.JPG)
.jpg)
C.4 References
- give a full list of the references you have used for this section
D. Process Reflection
The session of 2020 Coland seminar delivered a wide range of information and diverse types of landscape information about the coastal landscape to us. As our whole group is currently studying masters of landscape architecture so most of the part of the study we feel very challenging.
As we didn’t know before about the coastal landscape condition of the Belgian coast area so the whole task is very interesting for us. We learned about the typology and condition of the coastal landscape of Belgium. It’s not just about the location we studied but as a part of our study we did so many cases studied and it developed our perception about coastal landscapes of the European Union.
The course helped us to learn about various skills to see the landscape in different ways and analyze it by using different methods. For our group, most of the sessions were easy to follow but very few of them were a little confusing for us to understand as the lack of knowledge and theory.
Another thing is that we had a great combination on our team as we did one year of master’s course together so we had a better understanding to each other which helped us to divide our takes and also work as a team. This team power encourages us to analyze deeply on our study site and revel all the aspects and importance of the study area. The biggest limits for our team were that we were unable to visit the location physically which actually necessary for the design. It’s also very helpful for a better analysis, especially to go on field trips, to collect data directly from the locals what we're unable to do but we tried our best to find all the existing current documents from the internet.
In the end, we would link to say maybe we didn’t learn everything about a coastal landscape because it’s a vast topic to understand but for our team, it was a great experience and it will help us to study more about the coastal landscape in our future studies.