COLAND Case Study 2020 - Belgian Coast: Difference between revisions
Andra.birica (talk | contribs) |
Andra.birica (talk | contribs) |
||
| Line 110: | Line 110: | ||
<gallery caption=" " widths="500px" heights="200px" perrow="5"> | <gallery caption=" " widths="500px" heights="200px" perrow="5"> | ||
File: | File:de panne grafic 1-2.png|''System Analysis of Belgian Coast'' | ||
</gallery> | </gallery> | ||
Revision as of 04:37, 21 February 2020
>>>back to working groups overview
| Area | Belgian Coast | |
| Place | North Sea shoreline | |
| Country | Belgia | |
| Topics | Geographical cross-cutting; Sustainable housing; Green and blue infrastructure | |
| Author(s) | Andra Birica; Ruxandra Mihalcea; Alin Pricop; Irina Rusu; Ionela Popa; Mariana Silivestru; Mariana Bodea | |

| ||
Rationale
One of Belgium’s smaller regions is Flanders, which in turn brings a grand resource for the country: it’s serene coast towards the North Sea, with 68 km in lenght, consisting of a gently sloping sandy beach, backed by coastal dunes. With time, erroneous planning and climate change in the area made people realize of the long-term risks. Thus, we must adapt and correct the challenges of rapid urbanization, urban sprawl, erosion and the rising sea level, balancing and uniting 1- the protection of the cultural and natural heritage with 2- economical gains from the productive landscapes and tourism.
Location and scope
You can edit this map with the map editor
A Landscape System Analysis
A.1 Landscape layers and their system context
Geomorphology, landscape units and coastal typology
- Description of evolution, status quo and driving forces, is the coastal typology changing? Why is that? (approx 200 signs)
- add 1-2 graphical representations to the image gallery, you can add more if you like
-
add a caption
-
add a caption
Land use
- settlements, infrastructure, agriculture, resource extraction, natural areas, energy production...
- description of evolution, status quo and driving forces, is the land use likely to change? Why is that? (approx 200 signs)
- add 1-2 graphical representations to the image gallery, you can add more if you like
-
add a caption
-
add a caption
-
add a caption
Green/blue infrastructure
- What are the major potential elements of a green/blue infrastructure network? Are these likely to change/disappear? Why is that?
- You find my background material on green infrastructure in our reading list
- add 1-2 graphical representations to the image gallery, you can add more if you like
Green and blue infrastructure is particularly important because it has an impact on the environmental, social and economic level. This infrastructure can be encountered in various places, such as natural or semi-natural, urban, rural or marine areas. It can also include natural or man-made elements. On the Belgian coast the major potential elements of blue-green infrastructure network are represented by numerous natural and artificial parks, nature reserves and small lakes spread along the coastal area. Blue infrastructure is less represented than green infrastructure, meeting here Teteghem Lake, Spuikom, Vargeul, and other small lakes and canals.
The green infrastructure is represented by National Nature Reserve the Dune Marchand, Doornpanne Park, Maria Hendrikapark, Zeebos Park, Westhoek Nature Reserve, Sint-Pietersplas Park, Zwin Nature Park, etc., but also includes elements such as hedgerows, copses, bushes , orchards, woodlands, natural grasslands. Many of the natural parks have protection status and are integrated in the Natura 2000 Network due to the sand dunes and the special forests of the coastal area, among other elements of biodiversity. An important element of green infrastructure is agriculture, which covers an important area of the Belgian coast and which is essential for economic growth.
The main functions of the green-blue infrastructure are related to the conservation of biodiversity and the protection of ecosystems, the development of a sustainable economy and the promotion of health and wellbeing for the local communities, achieving a sustainable management of the area and maintaining a balance between the ecological functions and the multi-functional use of the lands.
All this elements representing the green and blue infrastructure are unlikely to disappear in the near future because most of them have natural landscape elements or represent important elements of the landscape, economy and society.
-
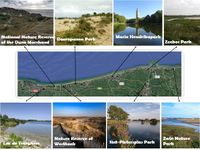 Green and blue infrastructure on the Belgian coast (Source: Google maps)

Actors and stakeholders
- Who is driving changes in this landscape? Who is affected by those changes?
- Draw a stakeholder and/or power map: Who is affected highly but with low power? Who has high power but is not affected?
-
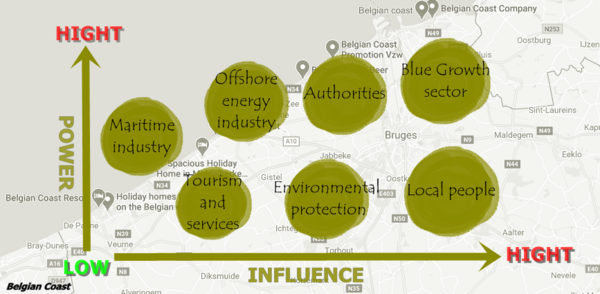 Belgian Coast Actors

Sacred spaces and heritage
- Which places/elements hold cultural value and to whom?
- You may add a map and some images, please also explain in your caption why these elements are valuable
-
add a caption
-
add a caption
-
add a caption
Visual appearance and landscape narrative
- Which elements are essential for the landscape character?
- Has the landscape been painted or otherwise depicted, when and whom? Which elements are essential?
- Which narratives exist? Who has written about this landscape or depicted it in some way?
- You can add text and images
Landscape character is defined as the distinct, recognisable and consistent pattern of elements in the landscape. It it these patterns that give each locality its 'sense of place', making one landscape different from another. Physical elements provide the fundamentally stable basic pattern of landscape, while cultural elements are superimposed on this and are more fluid, reflecting social and land use changes over time. Layered on top of this is the perceptual element – our own personal appreciation of landscape and how we relate to or make use of it, as individuals and communities.
An important project is taking place on the coast of Belgium, named Beaufort - an art project, triennial, in which the main role is played by the sea, an uncontrollable but unifying place. Every participating artist comes from a country that borders on the sea, which creates monuments that have different symbolisms, such as honoring characters who have made a significant contribution to society, illustrating tragic events or the connection between nature and man. The first edition of Beaufort took place in 2003 and was organised by then director of the Ostend Provincial Museum for Modern Art Willy Van den Bussche who would also remain the triennial’s curator in 2006. Monumental works found their place against the unique backdrop of the Coast, resulting in embodying the relationship between society and the environment and paying homage to both past times and events, as well as to the supremacy of the sea.
A.2 Summary of your landscape system analysis and your development targets
- You can summarize your findings with an DPSI(R) Model or a Spider Diagram
- Link back to the Sustainable Development Goals: Which goals are at risk?
- What is your hypothesis for this landscape?
- Visualise your hypothesis with one graphic/pict
- Are there any existing initiatives taking action in this landscape? Do you have a critical perspective on that?
- Add text and visuals
-
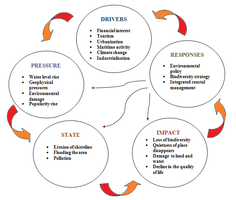 System Analysis of Belgian Coast

-
explain your hypthesis briefly in the caption
A.3 Theory reflection
- Reflect on at least three international policy documents in relation to their local landscape case
- choose one international, one European and one national document
- You can choose references from our reading list
- Scope: 250 words
A.4 References
- give a full list of the references you have used for this section
- https://www.google.ro/maps/@51.1937049,2.727344,63300m/data=!3m1!1e3
- http://chapter.ser.org/europe/files/2012/08/Coastal.dunes_.Westhoek-2008-excursion.pdf
- https://ec.europa.eu/environment/nature/ecosystems/docs/green_infrastructure_integration.pdf
- https://ec.europa.eu/environment/nature/ecosystems/docs/Green_Infrastructure.pdf
- http://bioveins.eu/blog/article2
Phase B: Landscape Evaluation and Assessment
B.1 Assessment Strategy
- Based on the hypothesis derived from your previous landscape systems analysis you are now asked to define the goals for assessing the landscape. Your assessment is the basis for evaluating the landscape status.
- Which elements and phenomena need to be mapped, why and how?
- This a text contribution, max 250 words
B.2 Mapping
- As defined by your assessment strategy you conduct the mapping and present your findings here
- As a minimum, at least three different themes need to be mapped, you may choose more if needed
-
briefly explain the findings of your mapping
-
briefly explain the findings of your mapping
-
briefly explain the findings of your mapping
B.3 Problem definition and priority setting
- Give a summary of the major findings of your mapping process, what are the problems/potentials identified?
- Draw a problems/potentials map
- Set priorities for the most relevant issues
-
add caption here
B.4 Theory reflection
- Please reflect the assessment and evaluation methods used based on at least three readings
- Did you encounter limitations'
- 200 words test contribution
B.5 References
- give a full list of the references you have used for this section
Phase C – Strategy and Master Plan
C.1 Goal Setting
- Define strategic planning objectives based on the evaluation findings
- Link back to your original targets from section one and the Development Goals
- 150 words text contribution
C.2 Spatial Strategy and Transect
- translate your strategic goals into a vision
- develop a spatial translation of your vision
- exemplify your vision in the form of a transect with concrete interventions
- add map(s) and visualizations
-
add caption here
-
add caption here
-
add caption here
-
add caption here
C.3 From Theory of Change to Implementation
- For implementing your vision: Which partnerships are needed? Which governance model is required?
- Who needs to act and how? Draw and explain a change/process model/timeline
- Which resources are needed? On which assets can you build?
- add 150 words text and visuals
-
add caption here
-
add caption here
C.4 References
- give a full list of the references you have used for this section
D. Process Reflection
- Reflect in your intercultural and interdisciplinary team on the outcomes of your study
- Which limitations were you facing?
- What have you learnt from each other?
- What would you do differently next time?
- You can also use diagrams/visuals
- 250 words text