COLAND Case Study 2020 - Nieuwpoort: Difference between revisions
| Line 74: | Line 74: | ||
From the socio-economic condition of the study area Nieuwpoort, our analysis found three major type of actors who are most dominating in the landscape. Fishermen are one of them who have very significant involvement with the economy and landscape but they have very low amount of power. Fish market is mainly controlled by the local municipality and municipality have the most power and also high involvement in the area. NGO’s and some public authorities are working with the fisherman to improve and betterment of the fish market of the locality. They are also involve with the local municipality and mainly controlled by them. So from the power map they can define as middle in power with high involvement. Another group is the local farmers who are currently in a stable condition because of their direct connection with economy and landscape and they can define as middle of the power and involvement. Tourist have involvement with the landscape as they are visiting this place for few days but they are very low in power. On the other hand local people have average power because they are also controlled by the local authorities and for this reason their involvement is also low. | From the socio-economic condition of the study area Nieuwpoort, our analysis found three major type of actors who are most dominating in the landscape. Fishermen are one of them who have very significant involvement with the economy and landscape but they have very low amount of power. Fish market is mainly controlled by the local municipality and municipality have the most power and also high involvement in the area. NGO’s and some public authorities are working with the fisherman to improve and betterment of the fish market of the locality. They are also involve with the local municipality and mainly controlled by them. So from the power map they can define as middle in power with high involvement. Another group is the local farmers who are currently in a stable condition because of their direct connection with economy and landscape and they can define as middle of the power and involvement. Tourist have involvement with the landscape as they are visiting this place for few days but they are very low in power. On the other hand local people have average power because they are also controlled by the local authorities and for this reason their involvement is also low. | ||
<gallery caption=" " widths=" | <gallery caption=" " widths="600px" heights="600px" perrow="1"> | ||
File:Power map.JPG|''POWER MAP'' | File:Power map.JPG|''POWER MAP'' | ||
</gallery> | </gallery> | ||
Revision as of 22:52, 1 March 2020
>>>back to working groups overview
| Area | please enter the area name here | |
| Place | please enter the town/village name | |
| Country | please enter the country here | |
| Topics | please enter the main coast-related topics here | |
| Author(s) | Please enter your name(s)- optional | |

| ||
Rationale
- The Flemish Nieuwpoort, a small town situated along the Belgian coast, at the mouth of the Yser River, on the North Sea. Nieuwpoort is widely known amongst its European neighbors for its rich offerings for tourism. The town also has a thousand years of history, which is reflected in its landmarks & monuments. Therefore, its tourism-based economy has a large impact on Nieuwpoort’s coastal landscape & natural environment. The objective of this project is to create a responsive landscape design that enhances the local economy & ecology without impacting its cultural heritage.
- Nieuwpoort, Belgian Coastal Area, Tourism-based Economy, Protected Areas, Public Art, Living Waters
Location and scope
You can edit this map with the map editor
A Landscape System Analysis
A.1 Landscape layers and their system context
Geomorphology, landscape units and coastal typology
- Description of evolution, status quo and driving forces, is the coastal typology changing? Why is that? (approx 200 signs)
- add 1-2 graphical representations to the image gallery, you can add more if you like
-
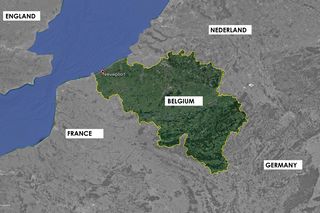 Nieuwpoort, Belgium
 -
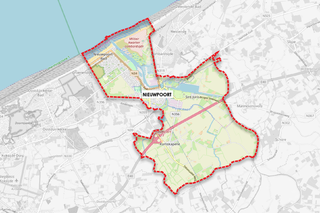 Nieuwpoort


Land use
The land-use of Nieuwpoort has included some different uses. As we can see on the map the major Landuse in the Nieuwpoort belongs to the agriculture and green spaces, almost in the south part of the city. The Red areas on the map are Settlements which located in the west of the Nieuwpoort. The Yellow areas show agriculture and green spaces such as pastures and natural grasslands. The blue lines and areas are waterbody and rivers, which is giving different identities to the city, and it has lots of potentials. The Violet color zones are the industry/commercial places. The sports and leisure facilities are shown in the white color. As it's visible in two maps (land use 2003 and 2012) we cannot see so many differences in the land use map, but what is visible is the settlement density changes. Due to the population growth and need of housing, and also tourism purpose city developed the housing area with high density, which shows us that in the near future the city needs more spaces for the development and we suppose that the next target will be the change of agriculture area to the settlement.
-
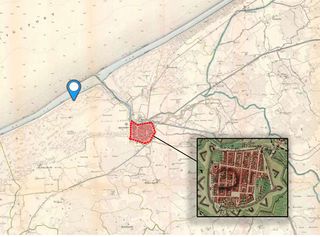 Land use around 1770
 -
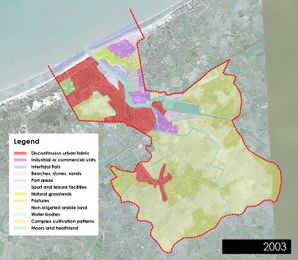 Land use 2003
 -
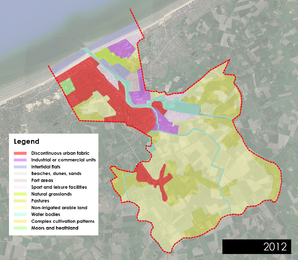 Land use 2012


Green/blue infrastructure
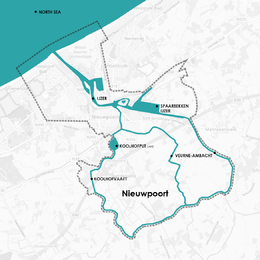
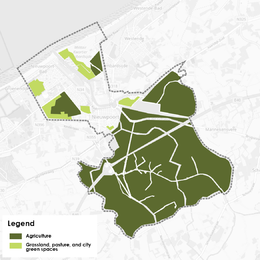
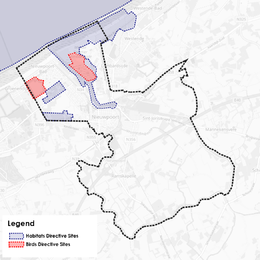
The Ijzer river is crossing the city of Nieuwpoort and reaches the North sea. The KOOLHOFVAART and VEURNE-AMBACHT rivers, as well as IJZER river, are the blue infrastructure which are bringing lots of potentials into the city. The tourism and recreational infrastructure are benefited from them as well as agriculture. The Agricultures, natural grasslands, heathlands, pastures, and urban green spaces are the Green infrastructure of the city of Nieuwpoort. As we can see on the map of Natura 2000 (natural protected areas) map, in the north part of the city we have Habitats and Birds Directive Sites. the BLUE areas are under Habitats Directive and the RED areas are under Birds Directive (Protection Areas). The need for housing will bring the city to the stage of decision making to develop the settlement into agriculture. Due to climate change and sea-level rise, there is the possibility of mixing the Fresh-water with the Sea-water, which will badly affect the green infrastructure.
-
 Blue Infrastructure
 -
 Green Infrastructure
 -
 Natura 2000


Actors and stakeholders
From the socio-economic condition of the study area Nieuwpoort, our analysis found three major type of actors who are most dominating in the landscape. Fishermen are one of them who have very significant involvement with the economy and landscape but they have very low amount of power. Fish market is mainly controlled by the local municipality and municipality have the most power and also high involvement in the area. NGO’s and some public authorities are working with the fisherman to improve and betterment of the fish market of the locality. They are also involve with the local municipality and mainly controlled by them. So from the power map they can define as middle in power with high involvement. Another group is the local farmers who are currently in a stable condition because of their direct connection with economy and landscape and they can define as middle of the power and involvement. Tourist have involvement with the landscape as they are visiting this place for few days but they are very low in power. On the other hand local people have average power because they are also controlled by the local authorities and for this reason their involvement is also low.
-
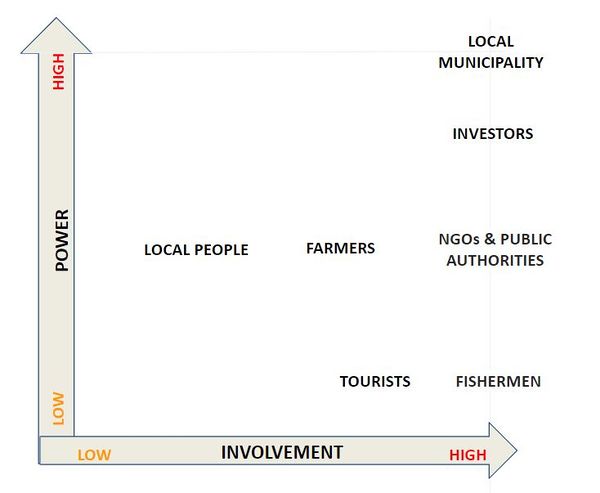 POWER MAP

Sacred spaces and heritage
Aside from the existing natural elements in the Nieuwpoort region (the wide beaches, the Yser river and it’s estuary, dunes and grasslands) which are tied to community identity, there are three major built elements in the landscape that are of key importance to local heritage and sacredness.
The first grouping is the architectural elements which are clustered in the old city with one outlier along the coast line. That outlier was the Vuurtoren, the coastal lighthouse, which guided boats into the harbor. Its first iteration was wooden, but was destroyed and rebuilt numerous times by the community. It’s current material is concrete, but it’s function, to keep the community safe, has not changed since the first one was first built in 1284.
Also keeping watch over the city has been the Onze-Lieve, Our Lady, Catholic Church, which was first constructed in 1163. This gothic church has been destroyed in multiple wars and rebuilt each time. Ironically, it houses a rare painting depicting the Battle of Nieuwpoort, from 1600.
The Bommenvrij, an old armory, the Stadshall and the church, even the lighthouse all signify the resilience of this landscape which has experienced much conflict throughout it’s history. The only architecture which succeeds at resisting a link to that identity is the Vismijn, the traditional fish market.
The next grouping of images, the landmarks, all carry on this link to the regions war torn past. The Duvetorre, once the St. Laurents Tower, was destroyed by war but never rebuilt. It keeps its relevance to the community by it’s association with the notorious Jean DePanne, an accused witch, who was know to use the space for devil worship. The Ganzepoot, which for most would appear to be a functional piece of infrastructure for managing water levels, was actually the tool used to stave off the Germans during WW I when a local citizen open the channel to flood the landscape, ultimately halting the advancing German army and saving the town. And the last landmark image, the Westfront, is actually a war memorial to that exact event.
However, the ties to heritage do not always determine community identity or correlate to the spaces that signify sacredness. Public sculpture, especially site specific art installations, are the essence of sacredness as they tie imagery and symbolism into the landscape through deeper concepts. The object tap into the landscape itself, while bringing new meaning with them by introducing new symbols. In Nieuwpoort there are four sculptural installations that root themselves in the landscape. The work by Jan Fabre in the image below ties itself to the horizon with a title that is both forward looking and optimistic. The work Men is placed in the tidal zone, so as to make the work seem almost dynamic, as it plays with the sea level on a daily basis. Oriented towards the town itself, it plays off a completely different energy than the Jan Fabre work.
There are two other works in the city, both are places around the harbor. The first, The Wind Blows Where it Wants is unique in that it is able to visualize a force that actually drives the landscape, the wind that forms the dunes. It gives body to a dynamic, powerful yet nearly invisible force that is a constant for coastal communities, by placing hundreds of flags in a space where the community is very likely to experience it. The last work De Poolreiziger is a work dedicated to a contemporary Belgian polar explorer who was also a citizen of the Nieuwpoort community.
In many ways, these structures evoke the experiences and values this community has at times in its history expressed or even absorbed in its present day.
-
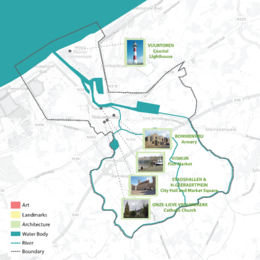 A map locating the architecture in the landscape which is tied to heritage, sacredness and identity
 -
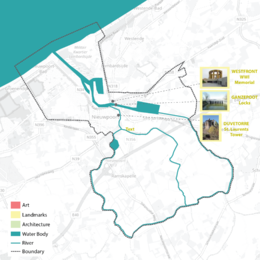 A map locating the landmarks in the landscape which are tied to heritage, sacredness and identity
 -
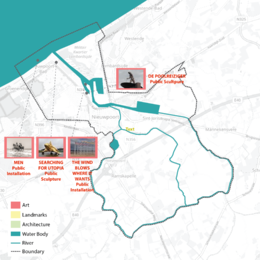 A map locating the art in the landscape which is tied to heritage, sacredness and identity


-
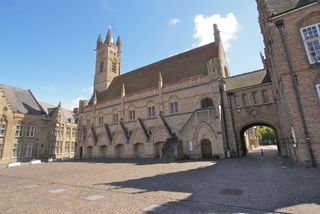 Belfort en Halle The bell tower in the Nieuwpoort city hall, a UNESCO World Heritage site, sits atop a nearly 600 year old structure that was completely destroyed in WW I and later rebuilt. It signifies community and resilience.
 -
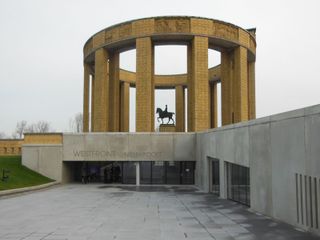 Westfront This WW I memorial is one of seven that incorporates a monument to Albert I, the Soldier King. It is strategically placed adjacent to the Ganzepoot locks on the Yser river, which were the key to preserving the country from complete German occupation during one of the war's major battles.
 -
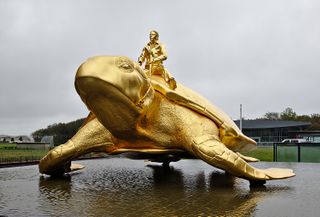 Searching for Utopia This sculpture, by world famous Belgian artist Jan Fabre, was installed at its site on the shoreline so that the gaze of the figure is looking out to sea at the horizon. Site specific installations of sculpture integrate landscape elements into their concept, embedding them into landscape identity.


Visual appearance and landscape narrative
- Prince Maurice at the Battle of Nieuwpoort, the painting was made on the time of Eighty years which is known as the Dutch war of independence. On 2 July 1600, on the command of Maurice of Nassau and Francis Vere, this battle happened near the city of Nieuwpoort. Famous painter Pauwels van Hillegaert who is known as a Dutch Golden Age painter of landscapes and military scene has painted this Battle of Nieuwpoort which actually reminds a history of this area.
- A Belgian artist named Alfred Bastien painted The channel in Nieuwpoort, which deliver a message about one of the important landscape character of this area. As the area is characterized by its coastal landscape but some of the channels are also significant to maintaining the landscape values.
- The Sea Beggars by Cecelia Holland, A historical novel about the preliminary stages of the Eighty Years' War (Dutch War of Independence). In this historic novel, in a part of the plot, it talks about the area of Nieuwpoort. The actual history of the conflict is long and complex, but Holland tells an insightful, if a small, slice of a much bigger picture, through the stories of one Dutch family.
-
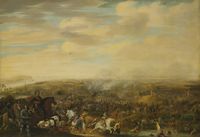 Prince Maurice at the Battle of Nieuwpoort by Pauwels van Hillegaert.
 -
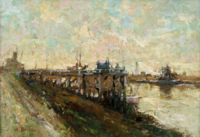 The channel in Nieuwpoort by Alfred Bastien
 -
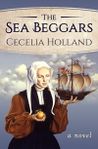 The sea beggars by Cecelia Holland


A.2 Summary of your landscape system analysis and your development targets
- Link back to the Sustainable Development Goals: Which goals are at risk?
- What is your hypothesis for this landscape?
- Visualise your hypothesis with one graphic/pict
- Are there any existing initiatives taking action in this landscape? Do you have a critical perspective on that?
- Add text and visuals


-
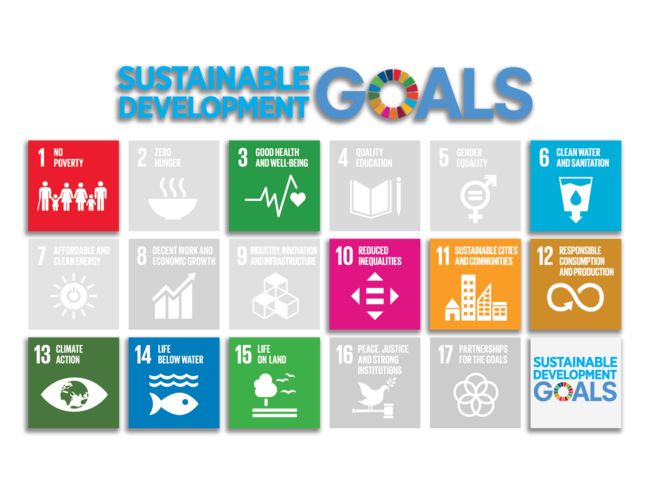 Sustainable Development Goals

-
The current coastline is already under pressure from intense tourism, which doubles the population of the city in the summer season. This influx has overinflated the housing market and the cost of living in Nieuwport, making it the most expensive region in Belgium to buy an apartment. Should the seasonal population boom continue at the same rate, the poverty gap will continue to widen and price many workers out of the housing market. In addition, a continued rise in the housing market valuations will inflate all real-estate rates, ultimately inflating the cost of living. To lessen this impact, pressure on green infrastructure and agricultural land will be the result of developers seeking out new opportunities to cash in. The resulting supporting infrastructure will add to air and water pollution while causing the ultimate loss of the valuable coastal estuary along the Yser river. Intensive coastal flooding due to climate shift will also damage the coastal estuary, ultimately leaving a less picturesque landscape and creating millions in property damage along the way. This series of events may result in tourism finally decreasing and the economy of the region losing it’s valued stability.
A.3 Theory reflection
Belgian National Adaptation Plan 2017 - 2020
Due to the reason of climate change effect and changing socio-economic condition of the Nieuwpoort costal area, few measures form Belgian National Adaptation Plan 2017 – 2020 need to be count. From out studies we can ensure that the Measure 1 (Development of high resolution climate scenarios for Belgium), Measure 7 (Evaluation of the socio-economic impacts of climate change in Belgium) and Measure 8 (Take climate change impacts and adaptation needs into account in the framework of the future National Environmental Health Action Plan -NEHAP) are directly and also indirectly involved in our study area (Nieuwpoort).
Ramsar International Convention on Wetlands 1975 - 2020
The Ramsar Convention on Wetlands of International Importance, which takes its name from the Iranian city where the convention was first signed in 1971, is a global treaty focusing on key areas of waterfowl habitat. Almost 90% of UN member states are a part of the Ramsar Convention.
Belgium currently has nine Ramsar sites totaling nearly 47,000 hectares of designated wetland. Three sites are located on the Belgian coast, with just one located in the North Sea itself. That particular 1900 hectar site, called Vlaamse Banken, is located on the coastal territory of Nieuwpoort. It includes both a beach zone and marine waters that contain a series of coastal banks that are key bird habitat. Designated in 1986, it has been listed as a Ramsar site for 35 years.
Wintering grebes and sea-ducks call this area home, while a number of shorebird species also include this habitat in their winter foraging and roosting zones. Commercial fishing, recreation and sand and gravel extraction are a threat to this environment.
- You can choose references from our reading list
- Scope: 250 words
A.4 References
- give a full list of the references you have used for this section
Phase B: Landscape Evaluation and Assessment
B.1 Assessment Strategy
- Based on the hypothesis derived from your previous landscape systems analysis you are now asked to define the goals for assessing the landscape. Your assessment is the basis for evaluating the landscape status.
- Which elements and phenomena need to be mapped, why and how?
- This a text contribution, max 250 words
B.2 Mapping
- As defined by your assessment strategy you conduct the mapping and present your findings here
- As a minimum, at least three different themes need to be mapped, you may choose more if needed
-
briefly explain the findings of your mapping
-
briefly explain the findings of your mapping
-
briefly explain the findings of your mapping
B.3 Problem definition and priority setting
- Give a summary of the major findings of your mapping process, what are the problems/potentials identified?
- Draw a problems/potentials map
- Set priorities for the most relevant issues
-
add caption here
B.4 Theory reflection
- Please reflect the assessment and evaluation methods used based on at least three readings
- Did you encounter limitations'
- 200 words test contribution
B.5 References
- give a full list of the references you have used for this section
Phase C – Strategy and Master Plan
C.1 Goal Setting
- Define strategic planning objectives based on the evaluation findings
- Link back to your original targets from section one and the Development Goals
- 150 words text contribution
C.2 Spatial Strategy and Transect
- translate your strategic goals into a vision
- develop a spatial translation of your vision
- exemplify your vision in the form of a transect with concrete interventions
- add map(s) and visualizations
-
add caption here
-
add caption here
-
add caption here
-
add caption here
C.3 From Theory of Change to Implementation
- For implementing your vision: Which partnerships are needed? Which governance model is required?
- Who needs to act and how? Draw and explain a change/process model/timeline
- Which resources are needed? On which assets can you build?
- add 150 words text and visuals
-
add caption here
-
add caption here
C.4 References
- give a full list of the references you have used for this section
D. Process Reflection
- Reflect in your intercultural and interdisciplinary team on the outcomes of your study
- Which limitations were you facing?
- What have you learnt from each other?
- What would you do differently next time?
- You can also use diagrams/visuals
- 250 words text