Gulf of Mexico - Tecolutla: Difference between revisions
| Line 118: | Line 118: | ||
<gallery caption=" " widths="500px" heights="200px" perrow="5"> | <gallery caption=" " widths="500px" heights="200px" perrow="5"> | ||
File: | File:D p s i r.png|''DPSIR analysis' | ||
</gallery> | </gallery> | ||
<gallery caption=" " widths="500px" heights="200px" perrow="5"> | <gallery caption=" " widths="500px" heights="200px" perrow="5"> | ||
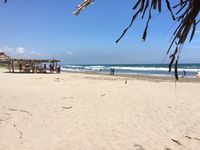
File: | File:Overview 01.jpg|''Current Bay overview'' | ||
</gallery> | </gallery> | ||
Revision as of 09:42, 29 April 2018
>>>back to working groups overview
| Area | Tecolutla Bay | |
| Place | Tecolutla | |
| Country | Mexico | |
| Topics | Tourism and nature protection | |
| Author(s) | Maythe Garcia Velarde | |

| ||
Rationale
Tecolutla Bay is one of the closest beach from Mexico City and much of its economy is based on tourism, as it is only a four or five hour drive from the capital. In the last years this area has been exploted in all its forms and capacities. The tourism, exploration of new oil wells, and agriculture are some of the main reasons that que quality of the place is decreasing.
Location and scope
You can edit this map with the map editor
A Landscape System Analysis
A.1 Landscape layers and their system context
Geomorphology, landscape units and coastal typology
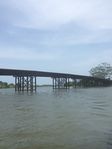
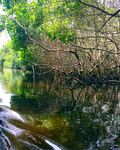
The landscape is comprised of sandy flat beaches, estuaries, canals, small fishing bays and mangroves. Water pollution is common here, not only for the tourists, but also from the excessive agricultural activity along the Tecolutla river.
-
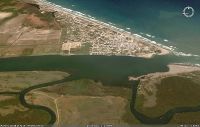 Tecolutla Bay and River connection
 -
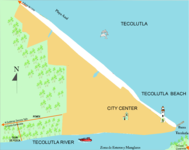
 Tecolutla Bay


Land use
In the maps belows shows the changes during the years and different land uses in the coast of Tecolutla. The land uses are divided in: Infrastructure, Agriculture, Swamps, Other wetlands, Water bodies, Another Vegetation and Without Vegetation. During the years the state had change the land use for more agricultural activities. This is affecting the river, flora and fauna.
-
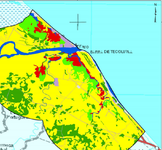 Land use map of 1976
 -
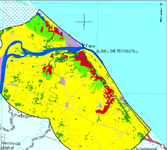 Land use map of 2005
 -
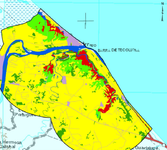 Land use map of 2010


Green/blue infrastructure
For green infrastructure there are beaches, forest, meadows, agricultural lands, exotic birds, and some types of reptiles. The blue infrastructure are, rivers, streams, lakes, pounds and the sea gulf. Due to the increase of surfaces dedicated to human activities (agriculture and urban use), the amount or quality of green and blue infrastructure decreased or has been affected.
-
 add a caption
 -
 add a caption


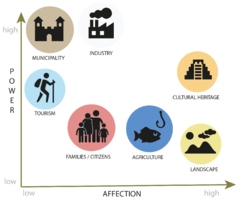
Actors and stakeholders
Tecolutla bay is one of the places where petroleum wells are located, now the Industry is investing more money to develop and make excavation around the area. But they are not thinking in the rural area, contamination of water and soil.This is making a problem with the fishermen of the area. The other one driver with high power is the municipality which is changing the land use all over the zone. The increase of agricultural fields is contaminating the river and decreasing the ammount of biodiversity in the area. The drivers who are most affected by these decitions are the landscape and the cultural heritage.
-
 add a caption

Sacred spaces and heritage
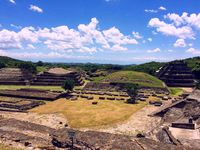
One element is the old structure pipes that were used in the past for the extraction of petroleum. 40 min away from the beach is located a protected area called "El Tajin", which is a archeological area with old ancient pyramids. These pyramids belong to the Totonaca culture. One of the elements that has cultural value at Tecolutla's bay is the river, which has mangroves that are protected by the people who is living there. This river is becoming a touristic attraction and the citizens created a tour in some part of the river. In this beach are located several camps dedicated to protect the sea turtle. This turtle is endangered, now a days tourists can go to these camps and they can liberate turtles.
- Which places/elements hold cultural value and to whom?
- You may add a map and some images, please also explain in your caption why these elements are valuable
-
 add a caption
 -
 add a caption
 -
 add a caption
 -


Visual appearance and landscape narrative
The tecolutla river was dicovered by Juan de Guijalva in 1518, three years before the Spanish Conquest of the Aztec Empire. This caused violent confrontations between the Spanish and the local people at first but eventually led a mixing of culture between the natives and the European. The totonaca culture is the one who develop a city. Now a days a 6% of the population is Totonac. There exist some sketches of the beach, represnting the most emblematic elements along it.
-
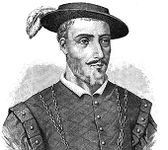 Juan de Guijalva
 -
 Totonac Culture
 -
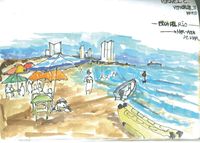 Sketch of the Bay


A.2 Summary of you landscape system analysis and your development Targets
- You can summarize your findings with an DPSI(R) Model or a Spider Diagram
- Link back to the Sustainable Development Goals: Which goals are at risk?
- What is your hypothesis for this landscape?
- Visualise your hypothesis with one graphic/pict
- Are there any existing initiatives taking action in this landscape? Do you have a critical perspective on that?
- Add text and visuals
-
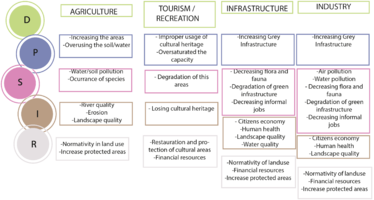 DPSIR analysis'

-
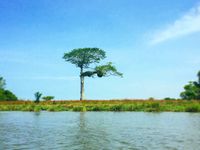
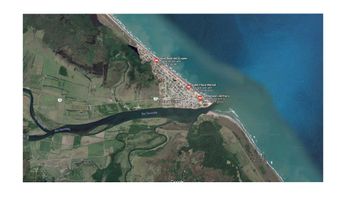 Current Bay overview

A.3 Theory reflection
- Reflect on at least three international policy documents in relation to their local landscape case
- choose one international, one European and one national document
- You can choose references from our reading list
- Scope: 250 words
A.4 References
- give a full list of the references you have used for this section
-http://painanicollective.blogspot.de/2013/02/tecolutla.html -Comision Nacional para el Conocimiento y Uso de la Biodiversidad (CONABIO), 2013. https://www.biografiasyvidas.com/biografia/g/grijalva.htm http://grupoindigenatotonacos.blogspot.de/2015/04/1-significadodel-nombre.html http://urbansketchers-mexico.blogspot.de/2011/04/veracruz.html
Phase B: Landscape Evaluation and Assessment
B.1 Assessment Strategy
- Based on the hypothesis derived from your previous landscape systems analysis you are now asked to define the goals for assessing the landscape. Your assessment is the basis for evaluating the landscape status.
- Which elements and phenomena need to be mapped, why and how?
- This a text contribution, max 250 words
B.2 Mapping
- As defined by your assessment strategy you conduct the mapping and present your findings here
- As a minimum, at least three different themes need to be mapped, you may choose more if needed
-
briefly explain the findings of your mapping
-
briefly explain the findings of your mapping
-
briefly explain the findings of your mapping
B.3 Problem definition and priority setting
- Give a summary of the major findings of your mapping process, what are the problems/potentials identified?
- Draw a problems/potentials map
- Set priorities for the most relevant issues
-
add caption here
B.4 Theory reflection
- Please reflect the assessment and evaluation methods used based on at least three readings
- Did you encounter limitations'
- 200 words test contribution
B.5 References
- give a full list of the references you have used for this section
Phase C – Strategy and Master Plan
C.1 Goal Setting
- Define strategic planning objectives based on the evaluation findings
- Link back to your original targets from section one and the Development Goals
- 150 words text contribution
C.2 Spatial Strategy and Transect
- translate your strategic goals into a vision
- develop a spatial translation of your vision
- exemplify your vision in the form of a transect with concrete interventions
- add map(s) and visualizations
-
add caption here
-
add caption here
-
add caption here
-
add caption here
C.3 From Theory of Change to Implementation
- For implementing your vision: Which partnerships are needed? Which governance model is required?
- Who needs to act and how? Draw and explain a change/process model/timeline
- Which resources are needed? On which assets can you build?
- add 150 words text and visuals
-
add caption here
-
add caption here
C.4 References
- give a full list of the references you have used for this section
D. Process Reflection
- Reflect in your intercultural and interdisciplinary team on the outcomes of your study
- Which limitations were you facing?
- What have you learnt from each other?
- What would you do differently next time?
- You can also use diagrams/visuals
- 250 words text