COLAND Case Study 2020 - Knokke: Difference between revisions
Ana.glisic (talk | contribs) No edit summary |
|||
| Line 91: | Line 91: | ||
* ''Who is driving changes in this landscape? Who is affected by those changes? | * ''Who is driving changes in this landscape? Who is affected by those changes? | ||
* ''Draw a stakeholder and/or power map: Who is affected highly but with low power? Who has high power but is not affected?'' | * ''Draw a stakeholder and/or power map: Who is affected highly but with low power? Who has high power but is not affected?'' | ||
''In this area, changes are caused of the erosion of the coast and the excessive building on the coast. Because of these changes, the beach is disturbed. | |||
The dwellers have the smallest power over those events but it's in their best interest to do something. On the other hand, the local authorities have more influence on those changes. Tourists have less power and less effect because of the short period of summer season.'' | |||
<gallery caption=" " widths="500px" heights="200px" perrow="5"> | <gallery caption=" " widths="500px" heights="200px" perrow="5"> | ||
File:your case_your powermap.jpg|''add a caption'' | File:your case_your powermap.jpg|''add a caption'' | ||
Revision as of 08:33, 21 February 2020
>>>back to working groups overview
| Area | Knokke - Dutch Border | |
| Place | Knokke | |
| Country | Belgium and Netherlands | |
| Topics | Transboundary area; Wetland of international importance; Natura 2000; Green and blue infrastructure | |
| Author(s) | Stefania Legeny, Irina Midoni, Roxana Ignat, Carla Gavrilescu, Maria Nuciu, Ioana Ciuca, Ana Glisic | |

| ||
Rationale
- Knokke, a town in the municipality of Knokke-Heist, located in the province of West Flanders in Flanders, Belgium, which is the most north-eastern coastalzone. Knokke is well known for its beaches and for the dike system.
- Land use has changed with economic, technological and cultural development of the area, and a large area of land is a Natura 2000 habitat.
- The green infrastructure of the area is primarily comprised of the Natura 2000 habitat network. It covers a large percentage of the area under forest, humid habitats, hedges, tufts and arable land, the coastline, agricultural land, a branched cycle path system, etc.
- The coastal area is constantly moving, a major factor is the erosion in the surface and the sedimentation processes, in addition to the human activities.
Location and scope
You can edit this map with the map editor
A Landscape System Analysis
A.1 Landscape layers and their system context
Geomorphology, landscape units and coastal typology
- Belgium can be divided into three main geographical regions, such as: in the north-west a coastal plain area, a central plateau area and in the southeast a high plateau of the Ardennes.
- With a coastal area of approximately 98 kilometers, bordering the southeastern part of the North Sea, the influence of the sea is felt in the cities of Belgium that are now protected against flooding.Belgium has a very small coastal area, but it hosts several types of coastal habitats, which are important for the flora and fauna of the area, such as: underground sand banks, sandy beaches, intertidal sand dunes, sand dunes and polder meadows. The coastal area is constantly moving, a major factor is the erosion in the surface and the sedimentation processes, in addition to the human activities, which can have a positive and negative impact.
- From a geological point of view, the territory of Belgium comprises various typologies formed over millions of years, in the north being cenozoic deposits consisting mostly of marine and unconsolidated sediments, in the south, the Paleozoic rocks dominate on large areas.
- The main human activities in the Belgian coast area include: extraction, maritime transport, fishing, industry and mining. All the activities have led to a degradation of the Belgian coast area, a qualitative and quantitative degradation of the coastal ecosystem. The managerial responsibility of governing the institutions is limited to the manifestation of state power from the federal, regional and local areas.
-
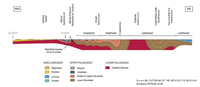 The geology of Belgium
 -
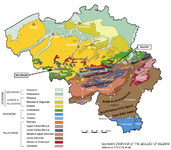 Geological eras of Belgium


Land use
- settlements, infrastructure, agriculture, resource extraction, natural areas, energy production...
- description of evolution, status quo and driving forces, is the land use likely to change? Why is that? (approx 200 signs)
- add 1-2 graphical representations to the image gallery, you can add more if you like
The most noticeable changes in land use from the 18th century to the present occur in the coastal zone. In the beginning of 20th century a dock was opened on the western border of the case study area and the town of Knokke has been expanding extensively towards the coast, an area once dominated by sand dunes. The percentage of area under discontinuous urban tissue and arable land with one-year crops is increasing. The Zwin, border and nature park, originally part of the channel that led to the fortification of the city of Suis, and the port between the border of the two countries - Belgium and the Netherlands, is today a less moist area of international importance. There is a tourist resort between the town of Knokka and nature park Zwin. Land use has changed with economic, technological and cultural development of the area. The most important directions of transport infrastructure from the 18th century to the present have remained unchanged in some sections. Cities were expanding towards potential tourist sites. However, in the 21st century, it seems that all the resources for this purpose are exploited and that further enhancement of tourism development can endanger the environment. Also, a large area of land is a Natura 2000 habitat.
-
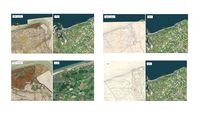 History of Knokke
 -
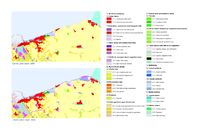 Corine Land Cover Changes 1990-2018
 -
 Natura 2000 Sites


Green/blue infrastructure
- What are the major potential elements of a green/blue infrastructure network? Are these likely to change/disappear? Why is that?
- You find my background material on green infrastructure in our reading list
- add 1-2 graphical representations to the image gallery, you can add more if you like
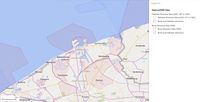
Natura 2000 sites:
- Dune areas and Zwin (Habitats Directive Sites)
- The Zwin (Birds Directive Sites)
- Zwin and Kievittepolder (Habitats Directive Sites and Birds Directive Sites)
The green infrastructure of the area is primarily comprised of the Natura 2000 habitat network. It covers a large percentage of the area under forest, humid habitats, hedges, tufts and arable land, the coastline, agricultural land, a branched cycle path system, etc.
Natura 2000 envisages measures to preserve protected habitats. This ensures their relative stability and prevents ecosystem damage. Green and blue infrastructure that is not part of recognized, protected habitats can be disrupted if the uncontrolled and reckless development of tourist settlements or other facilities that make these areas non-porous. Further development of climate change in the direction it is headed today will result in the primary drying up of temporary wet habitats and smaller water areas. Increasing green and blue infrastructure will positively influence the further development of sustainable mobility (cycling, walking) and fostering social gatherings (social aspect) by creating suitable microclimatic and macro-climatic conditions. Disrupting the blue and green infrastructure will reduce the economic gains from tourism.
-
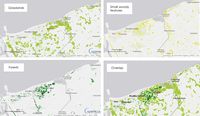 High Resolution Layers 2015 - Copernicus
 -
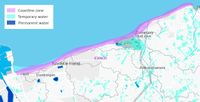 Coastline and Water Areas - Copernicus 2015
 -
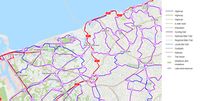 Transport infrastructure
 -
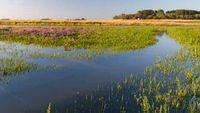 Sea lavender on the saltmarsh - The Zwin


Actors and stakeholders
- Who is driving changes in this landscape? Who is affected by those changes?
- Draw a stakeholder and/or power map: Who is affected highly but with low power? Who has high power but is not affected?
In this area, changes are caused of the erosion of the coast and the excessive building on the coast. Because of these changes, the beach is disturbed. The dwellers have the smallest power over those events but it's in their best interest to do something. On the other hand, the local authorities have more influence on those changes. Tourists have less power and less effect because of the short period of summer season.
-
add a caption
Sacred spaces and heritage
- Which places/elements hold cultural value and to whom?
- You may add a map and some images, please also explain in your caption why these elements are valuable
-
add a caption
-
add a caption
-
add a caption
Visual appearance and landscape narrative
- Knokke is known for its beautiful landscapes therefore is an inspiration for numerous artists to capture different aspects such as the magical dunes or windmills. Camille Pissarro is one of the artists that was mesmerized by this area, so he created in 1894 "The Dunes at Knokke" oil on Canvas, and "Windmill at Knokke", both paintings show the Impressionism style and highlight the mystical nature that surrounds Knokke.
-
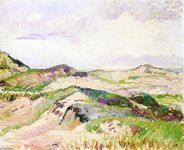 The Dunes at Knokke
 -
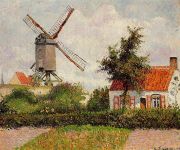 Windmill at Knokke-Belgium
 -
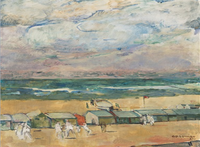 Beach with Beach


A.2 Summary of your landscape system analysis and your development targets
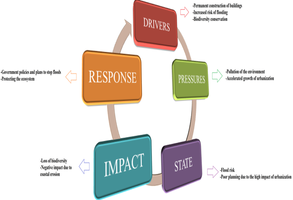
- You can summarize your findings with an DPSI(R) Model or a Spider Diagram
- Link back to the Sustainable Development Goals: Which goals are at risk?
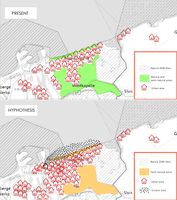
- What is your hypothesis for this landscape?
- Visualise your hypothesis with one graphic/pict
- Are there any existing initiatives taking action in this landscape? Do you have a critical perspective on that?
- Add text and visuals
Sustainable Development Goals at risk: Goal 3: Good Health and Well-being, Goal 11: Sustainable Cities and Communities, Goal 13: Climate Action, Goal 14: Life Below Water, Goal 15: Life on land, Goal 17: Partnerships to achieve the Goal.
Based on the historical development of the landscape and it’s current state it can be concluded in which way it will develop. Visible changes in the landscape in the next period will refer to the expanding of the city core and increasing of non-porous area to the city industrial zones. Density of population will increase and already damaged habitats in the tourist zone will degrade. The appearance of erosion is inevitable. Already fragmented landscape will lose the connection which allows the movement of matter and organisms. It can come to endagering of existing corridors. Increased density of population and overload of significant natural and historical features of the landscape will create invisible negative sources disturbing environmental health and quality of life. Habitats recognised through Natura 2000 program disable uncontrolled development of the surrounding parts of landscape, but to prevent indirect disturbing of this habitats under the influence of urbanised areas existance of buffer zones is necessary.
-
 DPSIR analysis of the Knokke area

-
 Hypothesis for The Knokke Area

A.3 Theory reflection
- Reflect on at least three international policy documents in relation to their local landscape case
- choose one international, one European and one national document
- You can choose references from our reading list
- Scope: 250 words
- United Nations. Sustainable Development Goals
- European Commission Natura 2000
- Decleer, 2008: Ecological Restoration in Flanders
A.4 References
- http://en.topimpressionists.com/TopImpressionists.nsf/A?Open&A=8EWDKX&fbclid=IwAR1l8zhmwsLG7T_acaR65iDT995BspjKcQxkU_6AfIGtGN5XVmY7WN1KfEw
- https://www.wikiart.org/en/camille-pissarro/windmill-at-knokke-belgium-1894?fbclid=IwAR2wr1THcwtzaIMTThYsjpXPd6mdeEbkaIeWQaCWoDAjTHuteF4c5Gtr14I
- https://www.researchgate.net/publication/264993155_An_overview_of_the_Geology_of_Belgium
- https://imcore.files.wordpress.com/2009/10/belgian_coast_case_study1.pdf
- https://www.persee.fr/doc/rjenv_0397-0299_2001_hos_26_1_3852
- https://ec.europa.eu/eurostat/documents/3217494/5728589/KS-HA-11-001-13-EN.PDF/c0dd33ed-0db2-4d8b-ae03-26d9bf3e57fc?version=1.0
- https://mapire.eu/en/map/belgium-1846/
- https://mapire.eu/en/map/europe-18century-firstsurvey/
- https://natura2000.eea.europa.eu/#
- https://land.copernicus.eu/
- https://ec.europa.eu/environment/archives/life/publications/lifepublications/lifefocus/documents/grassland.pdf
- https://land.copernicus.eu/
Phase B: Landscape Evaluation and Assessment
B.1 Assessment Strategy
- Based on the hypothesis derived from your previous landscape systems analysis you are now asked to define the goals for assessing the landscape. Your assessment is the basis for evaluating the landscape status.
- Which elements and phenomena need to be mapped, why and how?
- This a text contribution, max 250 words
B.2 Mapping
- As defined by your assessment strategy you conduct the mapping and present your findings here
- As a minimum, at least three different themes need to be mapped, you may choose more if needed
-
briefly explain the findings of your mapping
-
briefly explain the findings of your mapping
-
briefly explain the findings of your mapping
B.3 Problem definition and priority setting
- Give a summary of the major findings of your mapping process, what are the problems/potentials identified?
- Draw a problems/potentials map
- Set priorities for the most relevant issues
-
add caption here
B.4 Theory reflection
- Please reflect the assessment and evaluation methods used based on at least three readings
- Did you encounter limitations'
- 200 words test contribution
B.5 References
- give a full list of the references you have used for this section
Phase C – Strategy and Master Plan
C.1 Goal Setting
- Define strategic planning objectives based on the evaluation findings
- Link back to your original targets from section one and the Development Goals
- 150 words text contribution
C.2 Spatial Strategy and Transect
- translate your strategic goals into a vision
- develop a spatial translation of your vision
- exemplify your vision in the form of a transect with concrete interventions
- add map(s) and visualizations
-
add caption here
-
add caption here
-
add caption here
-
add caption here
C.3 From Theory of Change to Implementation
- For implementing your vision: Which partnerships are needed? Which governance model is required?
- Who needs to act and how? Draw and explain a change/process model/timeline
- Which resources are needed? On which assets can you build?
- add 150 words text and visuals
-
add caption here
-
add caption here
C.4 References
- give a full list of the references you have used for this section
D. Process Reflection
- Reflect in your intercultural and interdisciplinary team on the outcomes of your study
- Which limitations were you facing?
- What have you learnt from each other?
- What would you do differently next time?
- You can also use diagrams/visuals
- 250 words text