COLAND Case Study 2020 - Brugge - Zeebrugge
>>>back to working groups overview
Rationale
- Why do you think this case is relevant? What is your hypothesis considering the landscape challenges?
- Format: 3-4 sentences
Location and scope
You can edit this map with the map editor
A Landscape System Analysis
A.1 Landscape layers and their system context
Geomorphology, landscape units and coastal typology
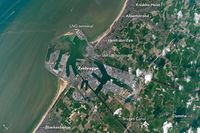
The name of the city comes from the word "Bryghia", meaning ‘landing stage' in Norse. It is an example of the medieval settlement. Bruges was named in 2002 as a cultural capital and is considered a UNESCO World Heritage Site From the beginning of its development, Bruges had has an important connection with the coast. Originally it was a landing place on the Zwin estuary, into which the Reie River flowed. In the 12th century, Bruges gained city status, but soon after the Zwin started to silt up. Bruges adapted by creating outports in Damme and Sluis; simultaneously, land transport became more and more prevalent. Another important factor in the costal zone of the studio area is the Blankenberge pier built in 1933. Likewise, the port of Zeebrugge (initially a village) has been developed since 1895. This is the area with the biggest changes since the small fishing settlement, dating from the end of the 19th century that was surrounded by natural beaches and dunes, was dwarfed by the enormous manmade harbour. All these interventions show the important commercial influence of the city, according to which, the coast typology can be defined as a set of man-made interventions among which, the tourist and commercial activities of the port are the most significant of the environment given its proportions.
Land use
- settlements, infrastructure, agriculture, resource extraction, natural areas, energy production...
- description of evolution, status quo and driving forces, is the land use likely to change? Why is that? (approx 200 signs)
- add 1-2 graphical representations to the image gallery, you can add more if you like
Blue/Green Infrastructure
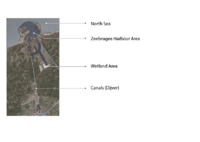
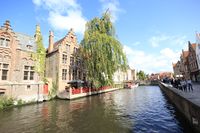
Blue Infrastructure: There are 4 Major elements of existing Blue Infrastructure. 1st one is obviously the North Sea which is connecting Belgium with the western side. Then there is the Zeebrugge harbour area. Although it is a part of the sea, it has an enclosed site area with different functions, so it can be marked as a separate and most dominant element Blue Infrastructure of that area. After that, there are two canal connections here in this site. One is connecting the city harbour with the main port area, and the other is connecting with the Dijver canal. This canal connection is well spread in the Brugee city and that’s why this city is called the “Venice of the North”.And the last one is the Wetland area, located in the side of Zeeburgee Harbor which actually helps to improve the water quality, reduce coastal storm damage and maintain ecosystem productivity.
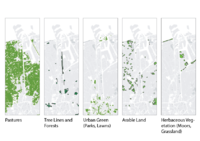
Green Infrastructure: From the map, it’s notable that the most of the study area except Zeebrugge harbour is occupied by Pastureland – which is generally covered with grass and other low plants and suitable for grazing animals, especially cattle or sheep. Then there a small portion of forest and Treelines. It is actually the green canopied area beside the canals and some small chunk of tress. Then there is the 3rd map of Urban Green area, which consists of Parks, Lawns and green recreational area. After that, there is some arable land in between the Pasture lands, which are used for agriculture and farming. And lastly, there is some herbaceous Vegetation, which is consist of Moors and grassland.
Actors and stakeholders
- Who is driving changes in this landscape? Who is affected by those changes?
- Draw a stakeholder and/or power map: Who is affected highly but with low power? Who has high power but is not affected?
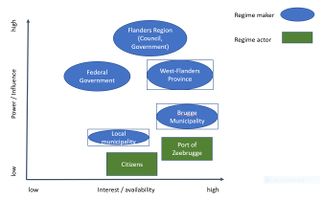
In the federal structure of Belgium, Flanders Region has full powers for spatial and environmental planning (industrial and economic development, seaports, coastal infrastructure, natural areas etc.) while the federal government has limited or no power in these matters. To varying degrees, both West-Flanders Province and Brugge Municipality, play a role of conversion through structural and implementation plans. Change in the Zeebrugge area is predominantly driven by the seaport development and the related economies and investments, as well as by the compensation scheme to create new natural sites. Because these competencies primarily belong to the Flemish Region and the West-Flanders Province, and not to the city of Brugge, citizens who are living in this territory has limited power to influence policy making.
Sacred spaces and heritage
- Bruges is the capital and largest city of the province of West Flanders in the Flemish Region of Belgium, in the northwest of the country.
The area of the whole city amounts to more than 13,840 hectares (138.4 km2; 53.44 sq miles), including 1,075 hectares off the coast, at Zeebrugge.The historic city centre is a prominent World Heritage Site of UNESCO. It is oval in shape and about 430 hectares in size. The city's total population is 117,073 (1 January 2008), of whom around 20,000 live in the city centre. The metropolitan area, including the outer commuter zone, covers an area of 616 km2 (238 sq mi) and has a total of 255,844 inhabitants as of 1 January 2008. Along with a few other canal-based northern cities, such as Amsterdam and St Petersburg, it is sometimes referred to as the Venice of the North. Bruges has a significant economic importance, thanks to its port, and was once one of the world's chief commercial cities. Bruges was a location of coastal settlement during prehistory. This Bronze Age and Iron Age settlement is unrelated to medieval city development. In the Bruges area, the first fortifications were built after Julius Caesar's conquest of the Menapii in the first century BC, to protect the coastal area against pirates. The Franks took over the whole region from the Gallo-Romans around the 4th century and administered it as the Pagus Flandrensis. The Viking incursions of the ninth century prompted Count Baldwin I of Flanders to reinforce the Roman fortifications; trade soon resumed with England and Scandinavia. Early medieval habitation starts in the 9th and 10th century on the Burgh terrain, probably with a fortified settlement and church.
- Bruges has most of its medieval architecture intact, making it one of the best preserved medieval towns in Europe. The historic centre of Bruges has been a UNESCO World Heritage Site since 2000. Many of its medieval buildings are notable, including the Church of Our Lady, whose brick spire reaches 115.6 m (379.27 ft), making it the world's second highest brick tower/building. The sculpture Madonna and Child, which can be seen in the transept, is believed to be the only of Michelangelo's sculptures to have left Italy within his lifetime.
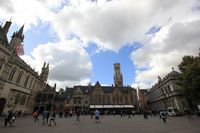
Bruges' most famous landmark is its 13th-century belfry, housing a municipal carillon comprising 47 bells. The city still employs a full-time carillonneur, who gives free concerts on a regular basis.
Other famous buildings in Bruges include:
The Béguinage (Dutch: Begijnhof), The Basilica of the Holy Blood (Dutch: Heilig-Bloedbasiliek). The relic of the Holy Blood, which was brought to the city after the Second Crusade by Thierry of Alsace, is paraded every year through the streets of the city. More than 1,600 inhabitants take part in this mile-long religious procession, many dressed as medieval knights or crusaders. The modern Concertgebouw ("Concert Building"), The Old St. John's Hospital, The Saint Salvator's Cathedral, The Groeningemuseum, which has an extensive collection of medieval and early modern art, including a notable collection of Flemish Primitives. Various masters, including Hans Memling and Jan van Eyck, lived and worked in Bruges. The City Hall on the Burg (Bruges) square, The Provincial Court (Provinciaal Hof), The preserved old city gateways: the Kruispoort, the Gentpoort, the Smedenpoort and the Ezelpoort. The Dampoort, the Katelijnepoort and the Boeveriepoort are gone.
Visual appearance and landscape narrative
- 01. Brugge has no specific sea beach
02. 1,075 hectares coastal area majorly occupied by Zeebrugge port 03. 12 km long Baudouin Canal with the North Sea.
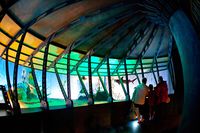
- 01. visitors can enjoy the story of coastal tourism past and present through maritime theme park, situated in the unique setting of the old fish market in Zeebrugge
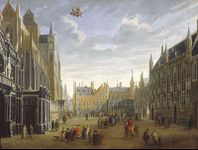
- The unique medieval pattern of streets, places and open spaces are depicted in painting by a famous Flemish painter Jan Baptist van Meunincxhove in1691–1700.
- You can add text and images
A.2 Summary of your landscape system analysis and your development targets
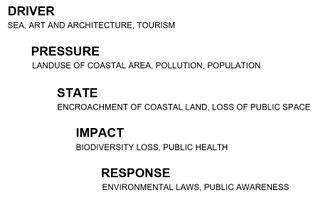
- You can summarize your findings with an DPSI(R) Model or a Spider Diagram
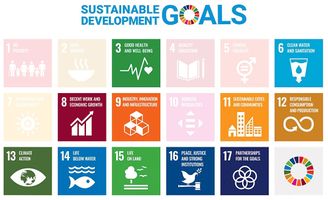
- Link back to the Sustainable Development Goals: Which goals are at risk?
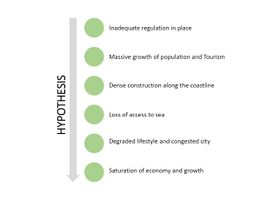
- What is your hypothesis for this landscape?
- Visualise your hypothesis with one graphic/pict
- UNESCO World Heritage Conservation works for the conservation of historical sites across the globe. The city of Brugge, being on coast is susceptible to global change in sea level due to climate change. USESCO being an international organization is capable of mitigation of global calamities. However, due to its international working arena, the concentration on the specific city (Brugge in this case) may not be sufficient.
- Add text and visuals
Goals at risk includes-> Goal 3: Good health and well-being for people Goal 6: Clean water and sanitation Goal 8: Decent work and economic growth Goal 11: Sustainable cities and communities Goal 12: Responsible consumption and production Goal 13: Climate action Goal 14: Life below water Goal 15: Life on land Goal 17: Partnerships for the goals
A.3 Theory reflection
- Reflect on at least three international policy documents in relation to their local landscape case
- choose one international, one European and one national document
- You can choose references from our reading list
- Scope: 250 words
A.4 References
- give a full list of the references you have used for this section
Phase B: Landscape Evaluation and Assessment
B.1 Assessment Strategy
From the last phase of the study “Landscape System Analysis”, we have identified some core factors & elements that have influences in our study area. Some of those factors are- Zeebrugge Port, The encroachment of Coastal land and converting into concrete jungles, the touristic city with very limited sea exposure, Oversaturation of economic growth and limited access to green space and coastline along with the North Sea. So we sorted our goals for this landscape assessment regarding those dominant factors in this area. Our three goals are-
Goal 01: Defining the pressure of Gray infrastructure and improving the condition of existing blue infrastructure
Goal 02: Generating more access to Green infrastructure along the beach area.
Goal 03: Indicating the Development threats along the coastline to the Protected Natural Site
In order to access our case study site, we have decided the following three themes to be mapped-
Map 1: Transportation -To show the concentration and distribution of roads and railways
Map 2: Green infrastructure ratio -To understand the ratio of green spaces compared to gray settlements
Map 3: Gradual Urban Development pattern with Natural Protected Sites -To analysis the economic infrastructure development trend (Industry and Housing Settlement) along with the coastline and its relation/collision with the natural protected sites
B.2 Mapping
- As defined by your assessment strategy you conduct the mapping and present your findings here
- As a minimum, at least three different themes need to be mapped, you may choose more if needed
- Your case your assessment mapping themel.jpg
briefly explain the findings of your mapping
- 1. Accessible green for agriculture
- 2. Accessible green for recreation
- 3. Possible expansion of future green
- 4. Restricted green space for pedestrian
- Brugge city has more than 50% direct accessible green for agriculture and recreation that is positive for inhabitants, tourists and finally it will help to reduce the pollution generated from gray infrastructures.
- The main challenge from green perspective in this site is about 15% regulated green space in between the zeebrugge port which has lost the accessibility for tourists and pedestrians''
- Your case your assessment mapping theme3.1.jpg
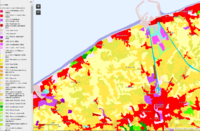
Here in this map, we can see the gradual development of basic-socio economic land cover. If we see the basic land use map of port, industry and the housing from Google earth map of 1984 and 2020, we can see that the Urban Developments are taking more and more land. And they are taking away the lands from agrarian fields. And from the Corine land cover map on the right site, we can notice that almost the whole coastline is covered with port, apartment blocks and industrial functions and a very few areas are naturally exposed to the sea. It is also clearly noticeable that the density of the urban fabric is higher along with the coast.
- Your case your assessment mapping theme3.2.jpg
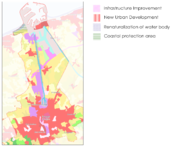
In our site, there is a huge portion of protected areas according to the Natura 2000 Protected area network. From the map, we can see that there are 5 Special Protection Areas (SPAs) for Bird Directives and 3 Special Areas of Conservation (SACs) for Habitat Directives. But there is no soft buffer zone in between the protected sites and the development zone. And the ongoing development process is causing a risk to those natural sites and also the coastal landscape ecosystem.
B.3 Problem definition and priority setting
Risks:
1. The continuous movement of the ship and cargo vehicles in the port area are causing pollution to the water and degrading the water quality of this coastal area.
2. The close attachment of the harbour with the Natura 2000 Bird protection Site. The movement and activity of ships and ports can hamper the habitat's lifestyle.
3. Then there are rapid developing Industrial areas and apartment blocks beside the coastline. It is taking away the exposure of the coastal line and also degrading the nature of the coastal area.
4. Discontinuous and disturbed coastline in the site. The beach is heavily segregated by the port and it is creating two different pictures on two sides of the port. On the left side, there are some natural sand beaches and some housing blocks. And on the right side is quite posh looking where there is the industry and also big residential areas. The beach on the right side is more organized and polished looking for tourist intervention like a caravan, beach chair, clubs and outdoor restaurants. But there is no soft infrastructure to pass into the port.
5. Special Areas of Conservation (SACs) for Habitat Directives are located just beside the coastline. So the climate change, sea level rising and coastal pollution can harm the specialities of that area.
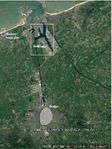
6. Fragmentation of Habitats by the linear port area. From the aerial view, it looks like it is separating the whole area by a straight line.
7. Over Exploitation of land-based connectivity (streets and railways) beside the coastline
8. Existing but under-utilizes waterways between Zeebrugge and Brugge
Potentials:
1. Great scope for developing coastal tourism. Sand beach in front of Knokke-Heist Housing Area has already developed a touristic setup.
2. The waterways/canal Between Zeebrugge Port and the Brugge city- which can be turned into a touristic infrastructure along with post-activity
3. Opening of Harbour Heritage as a part of tourists activity
4. Potential Zones for Accessible Green for the tourists and the local inhabitant in the whole site
5. And finally, there is Potentiality about the green tree line in the bank of canals, which can transform into public recreational space very easily.
- Your case problems potentials map.jpg
add caption here
Priority Goal:
From all the analysis, mapping and problem-potential findings, we have developed one goal, which will drive us to the design and planning phase. The goal is-
Improving touristic Infrastructure maintaining the natural settings of the coastline
For accomplishing the Goal in the design phase, we have also sorted out targets, which can as indicators also. Those are-
1. Sustainable Socio-economic development by conserving the protected area.
2. Developing walkways and bike trails between two side of the harbour.
3. Give attractiveness to the harborside.
4. Generating more accessible green space in between the port and surrounding the beach area considering port security.
5. Developing water-based public transportation
B.4 Theory reflection
- Please reflect the assessment and evaluation methods used based on at least three readings
- Did you encounter limitations'
- 200 words test contribution
B.5 References
- give a full list of the references you have used for this section
Phase C – Strategy and Master Plan
C.1 Goal Setting
- Define strategic planning objectives based on the evaluation findings
- Link back to your original targets from section one and the Development Goals
- 150 words text contribution
C.2 Spatial Strategy and Transect
- translate your strategic goals into a vision
- develop a spatial translation of your vision
- exemplify your vision in the form of a transect with concrete interventions
- add map(s) and visualizations
- Your case spatial translaton vision.jpg
add caption here
- Your case transect.jpg
add caption here
- Your case transect detail1.jpg
add caption here
- Your case transect detail2.jpg
add caption here
C.3 From Theory of Change to Implementation
- For implementing your vision: Which partnerships are needed? Which governance model is required?
- Who needs to act and how? Draw and explain a change/process model/timeline
- Which resources are needed? On which assets can you build?
- add 150 words text and visuals
- Your case spatial your governance model.jpg
add caption here
- Your case spatial your process model.jpg
add caption here
C.4 References
- give a full list of the references you have used for this section
D. Process Reflection
- Reflect in your intercultural and interdisciplinary team on the outcomes of your study
- Which limitations were you facing?
- What have you learnt from each other?
- What would you do differently next time?
- You can also use diagrams/visuals
- 250 words text


