Uploads by Amrita.ali
Jump to navigation
Jump to search
This special page shows all uploaded files.
| Date | Name | Thumbnail | Size | Description | Versions |
|---|---|---|---|---|---|
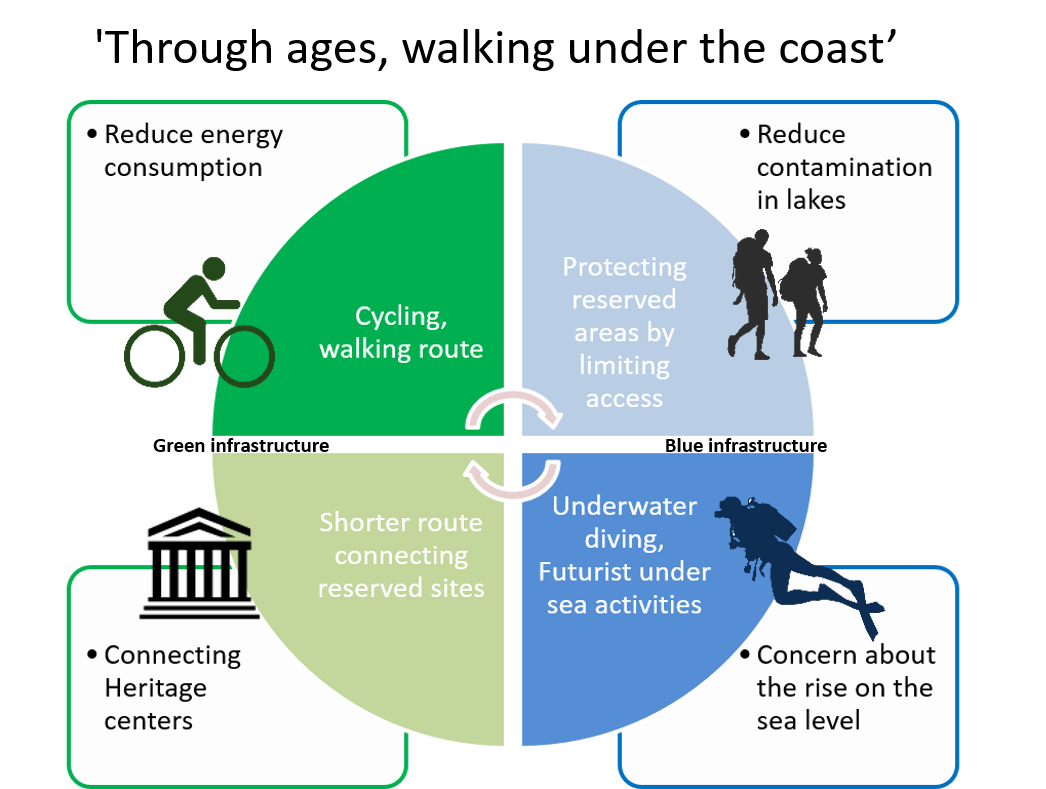
| 17:29, 10 June 2019 | Vision- and partner.png (file) |  |
206 KB | a collaboration of blue and green infrastructure to make the plan implemented | 1 |
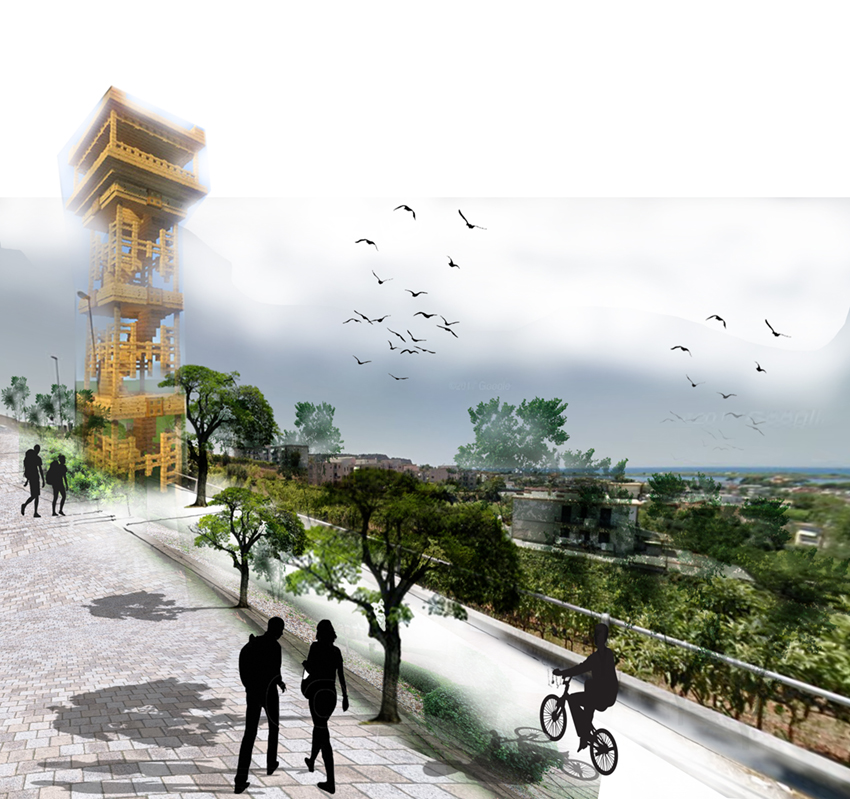
| 01:48, 10 June 2019 | Visualization-wiki.jpg (file) |  |
443 KB | A visualization of the pedestrian area of the master plan, with cycle route, walking trail, watching tower pause. | 1 |
| 01:42, 10 June 2019 | Master Plan-wiki.jpg (file) |  |
354 KB | Master plan showing a preliminary sketchy module of route planning and the pedestrian route accessible for tourist and local which will reduce the pressure of traffic on the residential alleys and make the visit for the tourist cost effective walkable... | 1 |
| 01:37, 10 June 2019 | Timeline baia-wiki.jpg (file) |  |
385 KB | This timeline basically shows the chronological study on Baia city and most effective historic events that made Baia a noteworthy area. | 1 |
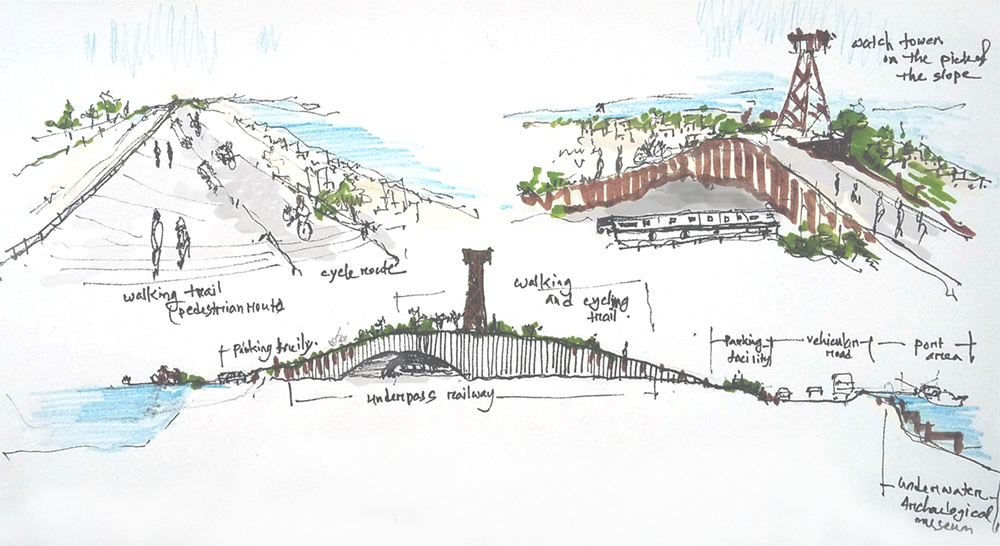
| 01:32, 10 June 2019 | Visualization of pedestrian route with raw sketches.png (file) |  |
845 KB | Some raw sketches to show how things will make differences and bring activity to the pedestrian route with pauses of sittings or watchtower on the peak may add in the experience of the visitors. | 1 |
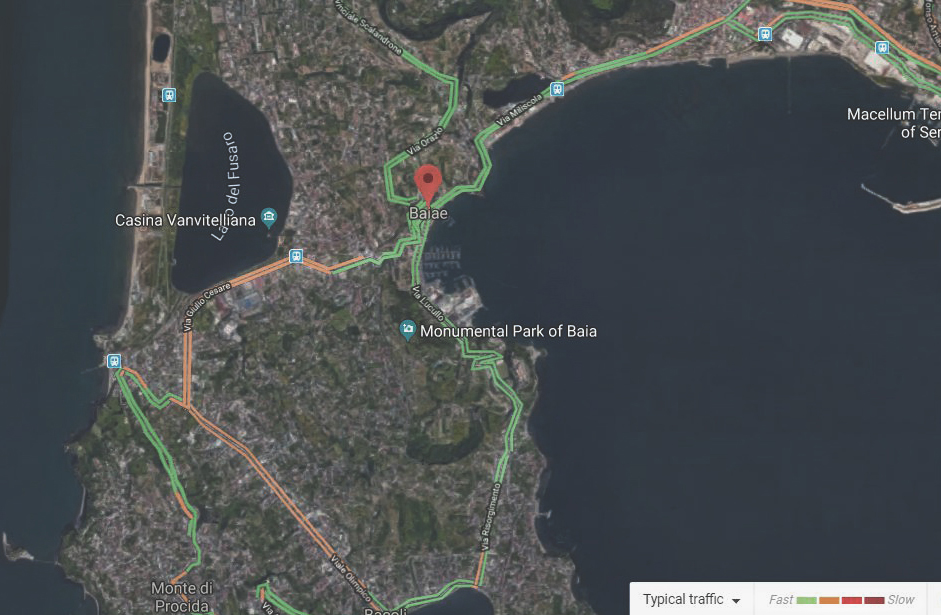
| 09:50, 3 May 2019 | Slow and fast traffic.JPG (file) |  |
324 KB | Google Traffic map shows which area has the faster traffic and which area deals generally with the slower Traffic inside the city of Baia | 1 |
| 09:47, 3 May 2019 | Findings conclusions from mobility maps n sections.png (file) |  |
1.69 MB | To improve the greenness of a city there is no alternative of public transport, Bi-cycle route to encourage cycling and wide pedestrians to improve the walkability all through the city may bring a charming change to this valuable historic site. Every i... | 1 |
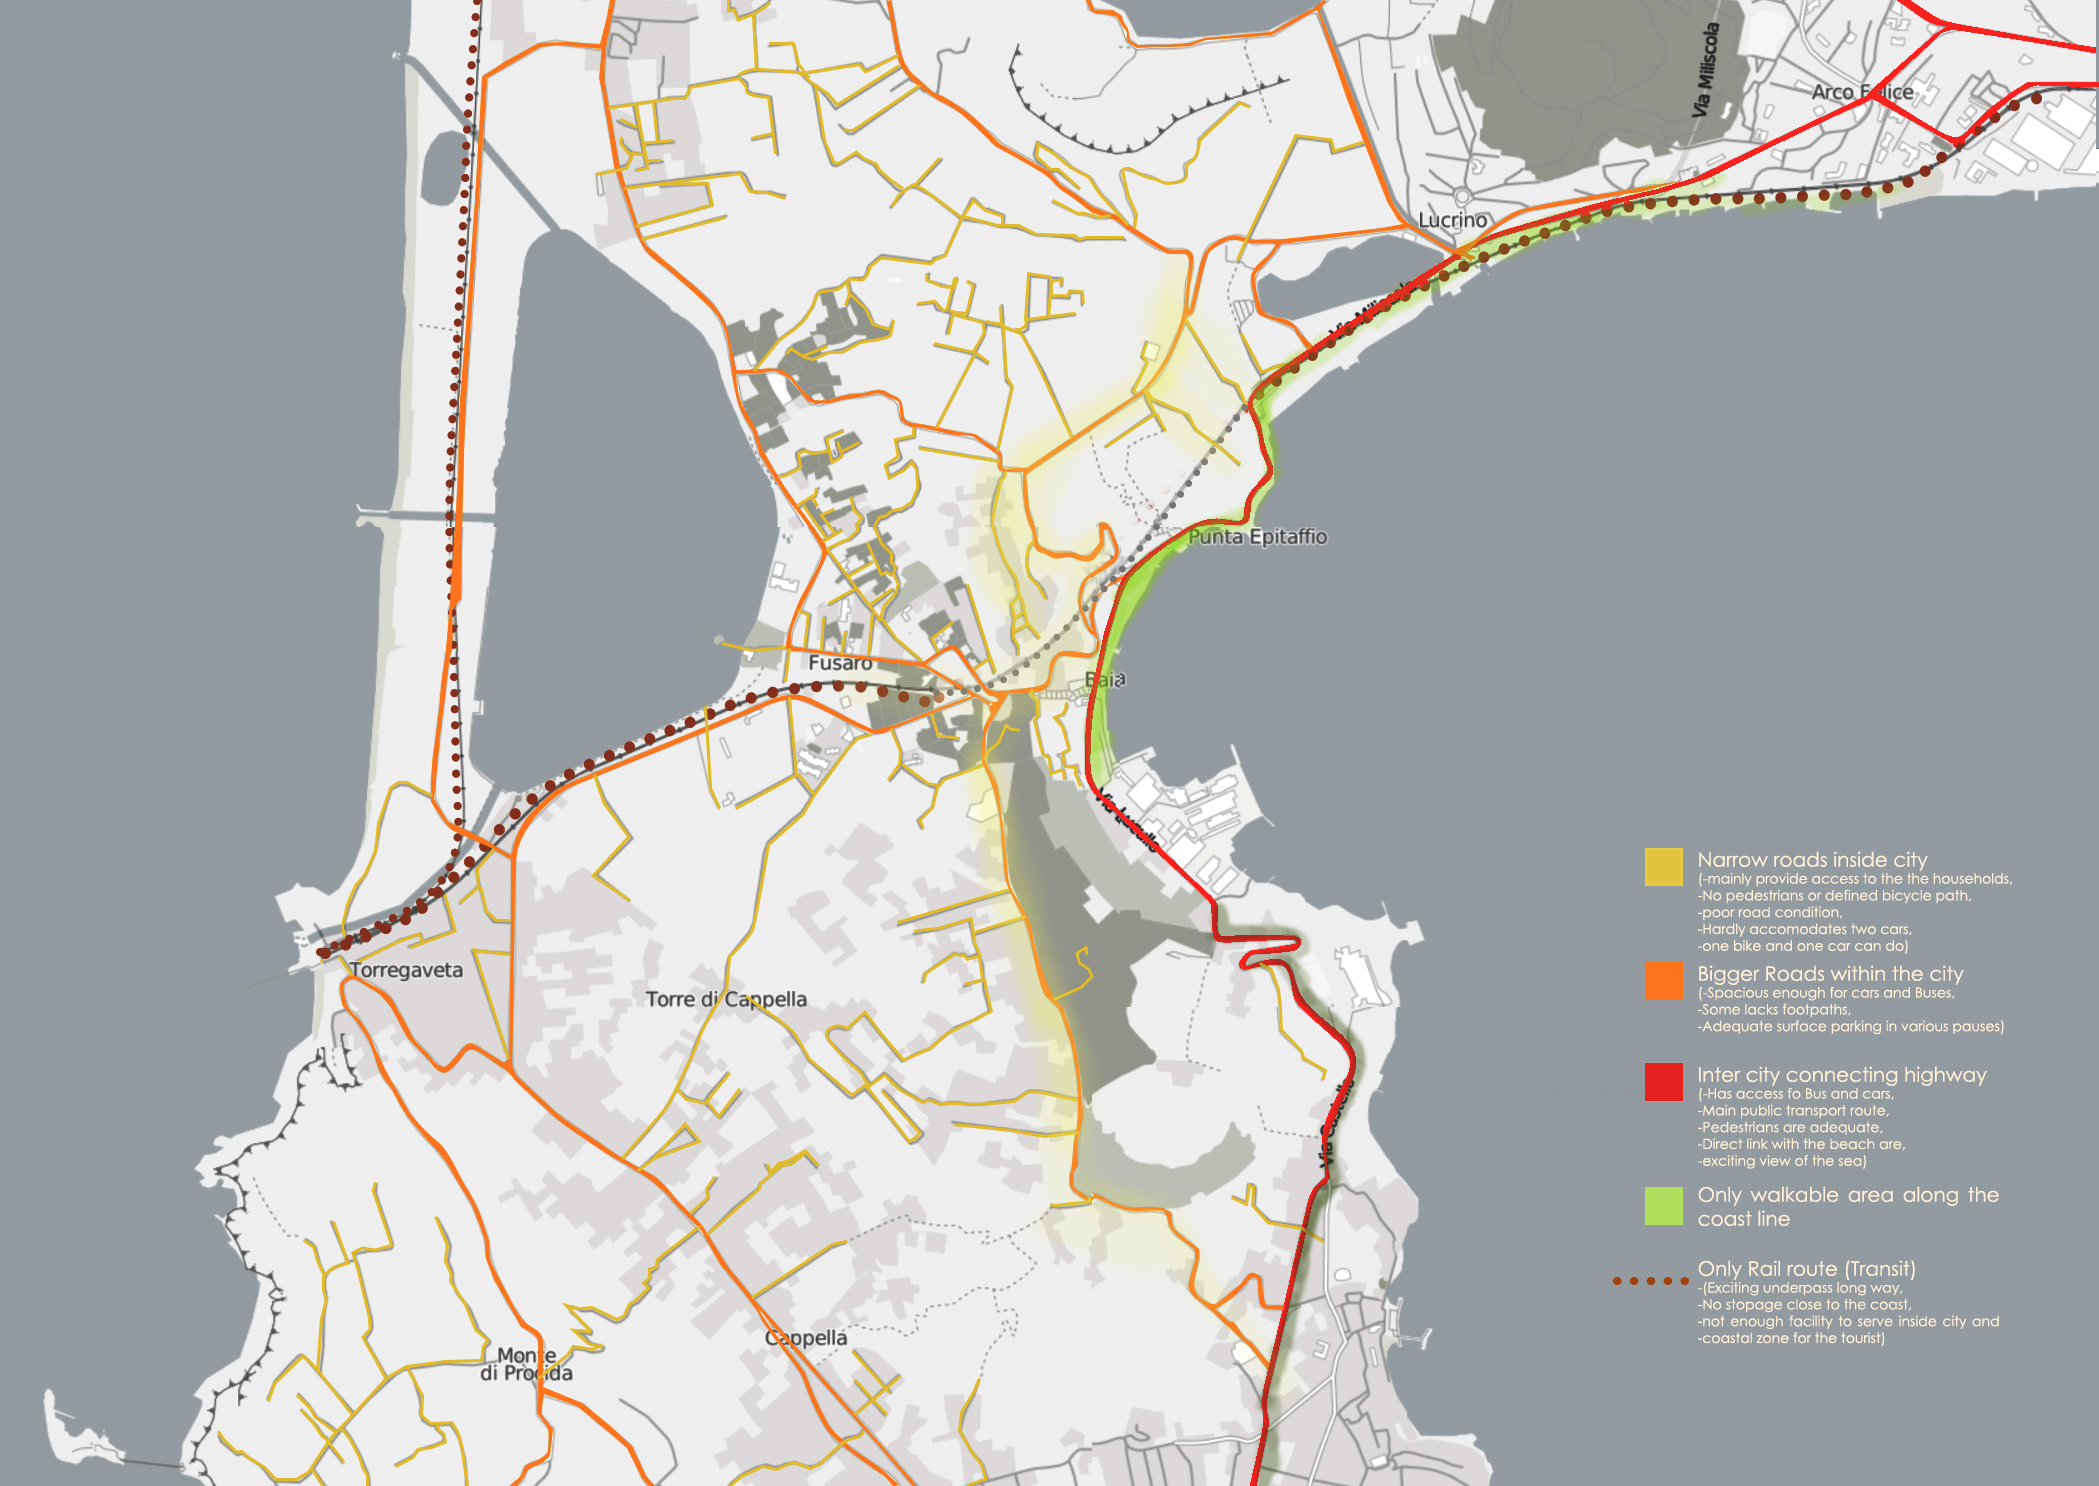
| 09:36, 3 May 2019 | Mobility and connection mapping of Baia city case study.jpg (file) |  |
1,021 KB | This map illustrates the Existing transportation route and mobility analysis. The yellow lines demonstrate the 'Narrow roads inside a city' and they mainly provide access to the households, -No pedestrians or defined bicycle path, have poor road condit... | 1 |
| 21:46, 4 April 2019 | Power loop Baia case study template.png (file) |  |
130 KB | 2 | |
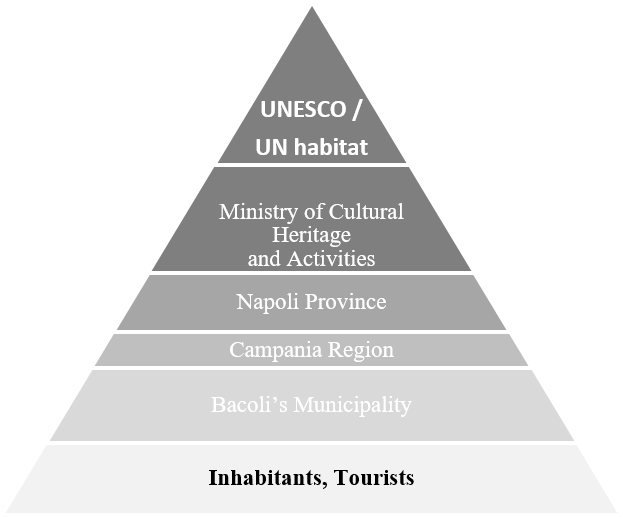
| 21:40, 4 April 2019 | Power Pyramid Baia case study template.png (file) |  |
19 KB | A Pyramid showing the power distribution in terms of size and power variation. For example, the Tourists and inhabitants are the greater populations by size by lies on the bottom of the Power level. Where different actors and administrative bodies who'... | 1 |
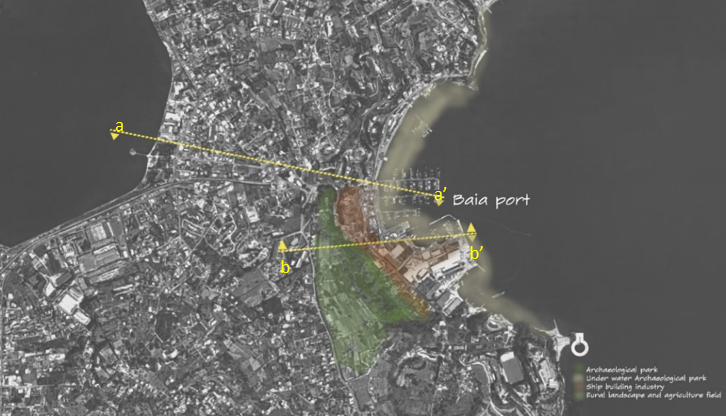
| 21:36, 4 April 2019 | Power plan Baia case study template.png (file) |  |
375 KB | Plan showing the section line of the two areas of Baia. The image is taken from the Google satellite image. | 1 |
| 21:32, 4 April 2019 | Adminstry of Baia case study template.png (file) |  |
25 KB | 2 | |
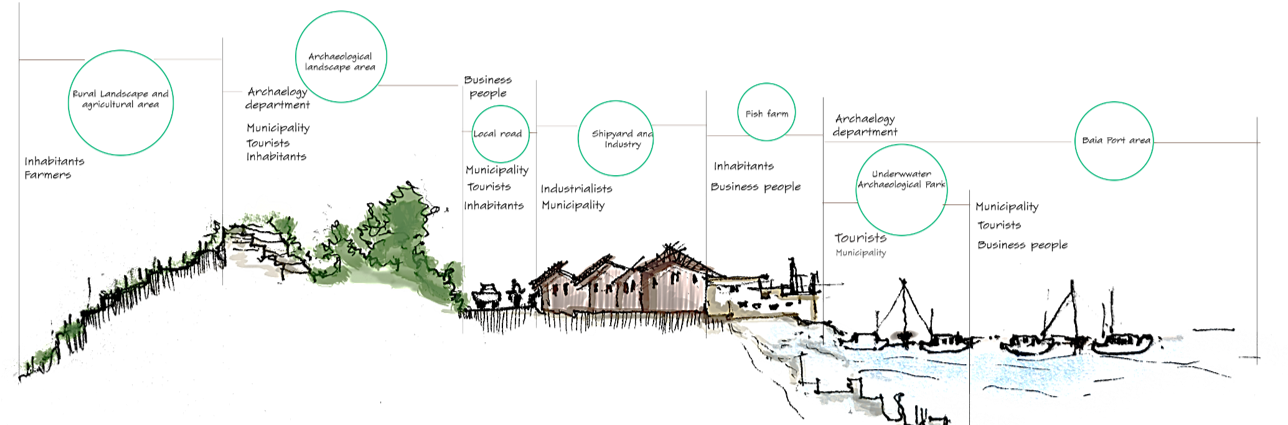
| 21:27, 4 April 2019 | BB' section case study template.png (file) |  |
307 KB | Cross section through Baia port and adjacent archaeological sites showing different actors and stakeholders relationship | 1 |
| 21:25, 4 April 2019 | AA' section case study template.png (file) |  |
364 KB | Cross section of Baia port and closest tourism area, analyzing different actors and stakeholders in site. | 1 |